DevOps For Developers: Continuous Integration, GitHub Actions & Sonar Cloud
When it is done badly, the CI process can turn this amazing tool into a nightmare. CI should make our lives easier, not the other way around.

Entrepreneur, author, blogger, open source hacker, speaker, Java rockstar, developer advocate and more. ex-Sun/Oracle guy with 30 years of professional development experience. Shai built virtual machines, development tools, mobile phone environments, banking systems, startup/enterprise backends, user interfaces, development frameworks and much more. Shai is an award winning highly rated speaker with a knack for engaging the audience and deep technical chops.
I first ran into the concept of Continuous Integration (CI) when the Mozilla project launched. It included a rudimentary build server as part of the process and this was revolutionary at the time. I was maintaining a C++ project that took 2 hours to build and link. We rarely went through a clean build which created compounding problems as bad code was committed into the project.
A lot has changed since those old days. CI products are all over the place and as Java developers we enjoy a richness of capabilities like never before. But I’m getting ahead of myself… Let’s start with the basics.
Continuous Integration is a software development practice in which code changes are automatically built and tested in a frequent and consistent manner. The goal of CI is to catch and resolve integration issues as soon as possible, reducing the risk of bugs and other problems slipping into production.
CI often goes hand in hand with Continuous Delivery (CD) which aims to automate the entire software delivery process, from code integration to deployment in production. The goal of CD is to reduce the time and effort required to deploy new releases and hotfixes, enabling teams to deliver value to customers faster and more frequently. With CD, every code change that passes the CI tests is considered ready for deployment, allowing teams to deploy new releases at any time with confidence. I won’t discuss continuous delivery in this post but I will go back to it as there’s a lot to discuss. I’m a big fan of the concept but there are some things we need to monitor.
Continuous Integration Tools
There are many powerful continuous integration tools. Here are some commonly used tools:
Jenkins: Jenkins is one of the most popular CI tools, offering a wide range of plugins and integrations to support various programming languages and build tools. It is open-source and offers a user-friendly interface for setting up and managing build pipelines. It’s written in Java and was often my “go to tool”. However, it’s a pain to manage and set-up. There are some “Jenkins as a service” solutions that also clean up its user experience which is somewhat lacking.
Travis CI: Travis CI is a cloud-based CI tool that integrates well with GitHub, making it an excellent choice for GitHub-based projects. Since it predated GitHub Actions it became the default for many open source projects on GitHub.
CircleCI: CircleCI is a cloud-based CI tool that supports a wide range of programming languages and build tools. It offers a user-friendly interface but it’s big selling point is the speed of the builds and delivery.
GitLab CI/CD: GitLab is a popular source code management tool that includes built-in CI/CD capabilities. The GitLab solution is flexible yet simple, it has gained some industry traction even outside of the GitLab sphere.
Bitbucket Pipelines: Bitbucket Pipelines is a cloud-based CI tool from Atlassian that integrates seamlessly with Bitbucket, their source code management tool. Since it's an Atlassian product it provides seamless JIRA integration and very fluid, enterprise oriented functionality.
Notice I didn’t mention GitHub Actions which we will get to shortly. There are several factors to consider when comparing CI tools:
Ease of Use: Some CI tools have a simple setup process and user-friendly interface, making it easier for developers to get started and manage their build pipelines.
Integration with Source Code Management (SCM) Tools such as GitHub, GitLab, and Bitbucket. This makes it easier for teams to automate their build, test, and deployment processes.
Support for Different Programming Languages and Build Tools: Different CI tools support different programming languages and build tools, so it's important to choose a tool that is compatible with your development stack.
Scalability: Some CI tools are better suited to larger organizations with complex build pipelines, while others are better suited to smaller teams with simpler needs.
Cost: CI tools range in cost from free and open-source to commercial tools that can be expensive, so it's important to choose a tool that fits your budget.
Features: Different CI tools offer distinct features, such as real-time build and test results, support for parallel builds, and built-in deployment capabilities.
In general, Jenkins is known for its versatility and extensive plugin library, making it a popular choice for teams with complex build pipelines. Travis CI and CircleCI are known for their ease of use and integration with popular SCM tools, making them a good choice for small to medium-sized teams. GitLab CI/CD is a popular choice for teams using GitLab for their source code management, as it offers integrated CI/CD capabilities. Bitbucket Pipelines is a good choice for teams using Bitbucket for their source code management, as it integrates seamlessly with the platform.
Cloud vs. On Premise
The hosting of agents is an important factor to consider when choosing a CI solution. There are two main options for agent hosting: cloud-based and on-premise.
Cloud-based: Cloud-based CI solutions, such as Travis CI, CircleCI, GitHub Actions, and Bitbucket Pipelines, host the agents on their own servers in the cloud. This means that you don't have to worry about managing the underlying infrastructure, and you can take advantage of the scalability and reliability of the cloud.
On-premise: On-premise CI solutions, such as Jenkins, allow you to host the agents on your own servers. This gives you more control over the underlying infrastructure, but also requires more effort to manage and maintain the servers.
When choosing a CI solution, it's important to consider your team's specific needs and requirements. For example, if you have a large and complex build pipeline, an on-premise solution such as Jenkins may be a better choice, as it gives you more control over the underlying infrastructure. On the other hand, if you have a small team with simple needs, a cloud-based solution such as Travis CI may be a better choice, as it is easy to set up and manage.
Agent Statefulness
Statefulness determines whether the agents retain their data and configurations between builds.
Stateful Agents: Some CI solutions, such as Jenkins, allow for stateful agents, which means that the agents retain their data and configurations between builds. This is useful for situations where you need to persist data between builds, such as when you're using a database or running long-running tests.
Stateless Agents: Other CI solutions, such as Travis CI, use stateless agents, which means that the agents are recreated from scratch for each build. This provides a clean slate for each build, but it also means that you need to manage any persisted data and configurations externally, such as in a database or cloud storage.
There’s a lively debate among CI proponents regarding the best approach. Stateless agents provide a clean and easy to reproduce environment. I choose them for most cases and think they are the better approach.
Stateless agents can be more expensive too as they are slower to set up. Since we pay for cloud resources that cost can add up. But the main reason some developers prefer the stateful agents is the ability to investigate. With a stateless agent when a CI process fails you are usually left with no means of investigation other than the logs. With a stateful agent, we can log into the machine and try to run the process manually on the given machine. We might reproduce an issue that failed and gain insight thanks to that. A company I worked with chose Azure over GitHub Actions because Azure allowed for stateful agents. This was important to them when debugging a failed CI process.
I disagree with that but that’s a personal opinion. I feel I spent more time troubleshooting bad agent cleanup than I benefited from investigating a bug. But that’s a personal experience and some smart friends of mine disagree.
Repeatable Builds
Repeatable builds refer to the ability to produce the same exact software artifacts every time a build is performed, regardless of the environment or the time the build is performed. From a DevOps perspective, having repeatable builds is essential to ensuring that software deployments are consistent and reliable. Intermittent failures are the bane of DevOps everywhere and they are painful to track. Unfortunately, there’s no easy fix. As much as we’d like it, some flakiness finds its way into projects with reasonable complexity. It is our job to minimize this as much as possible. There are two blockers to repeatable builds:
Dependencies - if we don’t use specific versions for dependencies even a small change can break our build.
Flaky Tests - tests that fail occasionally for no obvious reasons are the absolute worst.
When defining dependencies we need to focus on specific versions. There are many versioning schemes but over the past decade, the standard three-number semantic versioning took over the industry. This scheme is immensely important for CI as its usage can significantly impact the repeatability of a build e.g. with maven we can do:
<dependency>
     <groupId>group</groupId>
     <artifactId>artifact</artifactId>
     <version>2.3.1</version>
</dependency>
This is very specific and great for repeatability. However, this might become out of date quickly. We can replace the version number with LATEST or RELEASE which will automatically get the current version. This is bad as the builds will no longer be repeatable. However, the hard-coded three-number approach is also problematic. It’s often the case that a patch version represents a security fix for a bug. In that case, we would want to update all the way to the latest minor update but not newer versions. E.g. For that previous case I would want to use version 2.3.2 implicitly and not 2.4.1. This trades off some repeatability for minor security updates and bugs. But a better way would be to use the Maven Versions Plugin and periodically invoke the mvn versions:use-latest-releases command. This updates the versions to the latest to keep our project up to date.
This is the straightforward part of repeatable builds. The difficulty is in the flaky tests. This is such a common pain that some projects define a “reasonable amount” of failed tests and some projects re-run the build multiple times before acknowledging failure.
A major cause of test flakiness is state leakage. Tests might fail because of subtle side effects left over from a previous test. Ideally, a test should clean up after itself so each test will run in isolation. In a perfect world, we would run every test in a completely isolated fresh environment, but this isn’t practical. It would mean tests would take too long to run and we would need to wait a great deal of time for the CI process. We can write tests with various isolation levels, sometimes we need complete isolation and might need to spin up a container for a test. But most times we don’t and the difference in speed is significant.
Cleaning up after tests is very challenging. Sometimes state leaks from external tools such as the database can cause a flaky test failure. To ensure repeatability of failure, it is a common practice to sort the test cases consistently, this ensures future runs of the build will execute in the same order.
This is a hotly debated topic. Some engineers believe that this encourages buggy tests and hides problems we can only discover with a random order of tests. From my experience, this did indeed find bugs in the tests, but not in the code. My goal isn’t to build perfect tests and so I prefer running the tests in a consistent order such as alphabetic ordering.
It is important to keep statistics of test failures and never simply press retry. By tracking the problematic tests and the order of execution for a failure, we can often find the source of the problem. Most times the root cause of the failure happens because of faulty cleanup in a prior test, which is why the order matters and its consistency is also important.
Developer Experience and CI Performance
We’re here to develop a software product, not a CI tool. The CI tool is here to make the process better. Unfortunately, many times the experience with the CI tool is so frustrating that we end up spending more time on logistics than actually writing code. Often I spent days trying to pass a CI check so I could merge my changes. Every time I get close, another developer would merge their change first and would break my build.
This contributes to a less than stellar developer experience, especially as a team scales and we spend more time in the CI queue than merging our changes. There are many things we can do to alleviate these problems:
Reduce duplication in tests - over testing is a common symptom that we can detect with coverage tools.
Flaky test elimination - I know deleting or disabling tests is problematic. Don’t do that lightly. But if you spend more time debugging the test than debugging your code, it’s value is debatable.
Allocate additional or faster machines for the CI process.
Parallelize the CI process. We can parallelize some build types and some tests.
Split the project into smaller projects - notice that this doesn’t necessarily mean microservices.
Ultimately, this connects directly to the productivity of the developers. But we don’t have profilers for these sorts of optimizations. We have to measure each time, this can be painstaking.
GitHub Actions
GitHub Actions is a continuous integration/continuous delivery (CI/CD) platform built into GitHub. It is stateless although it allows the self-hosting of agents to some degree. I’m focusing on it since it’s free for open-source projects and has a decent free quota for closed-source projects.
This product is a relatively new contender in the field, it is not as flexible as most other CI tools mentioned before. However, it is very convenient for developers thanks to its deep integration with GitHub and stateless agents.
To test GitHub Actions, we need a new project which in this case I generated using JHipster with the configuration seen here:
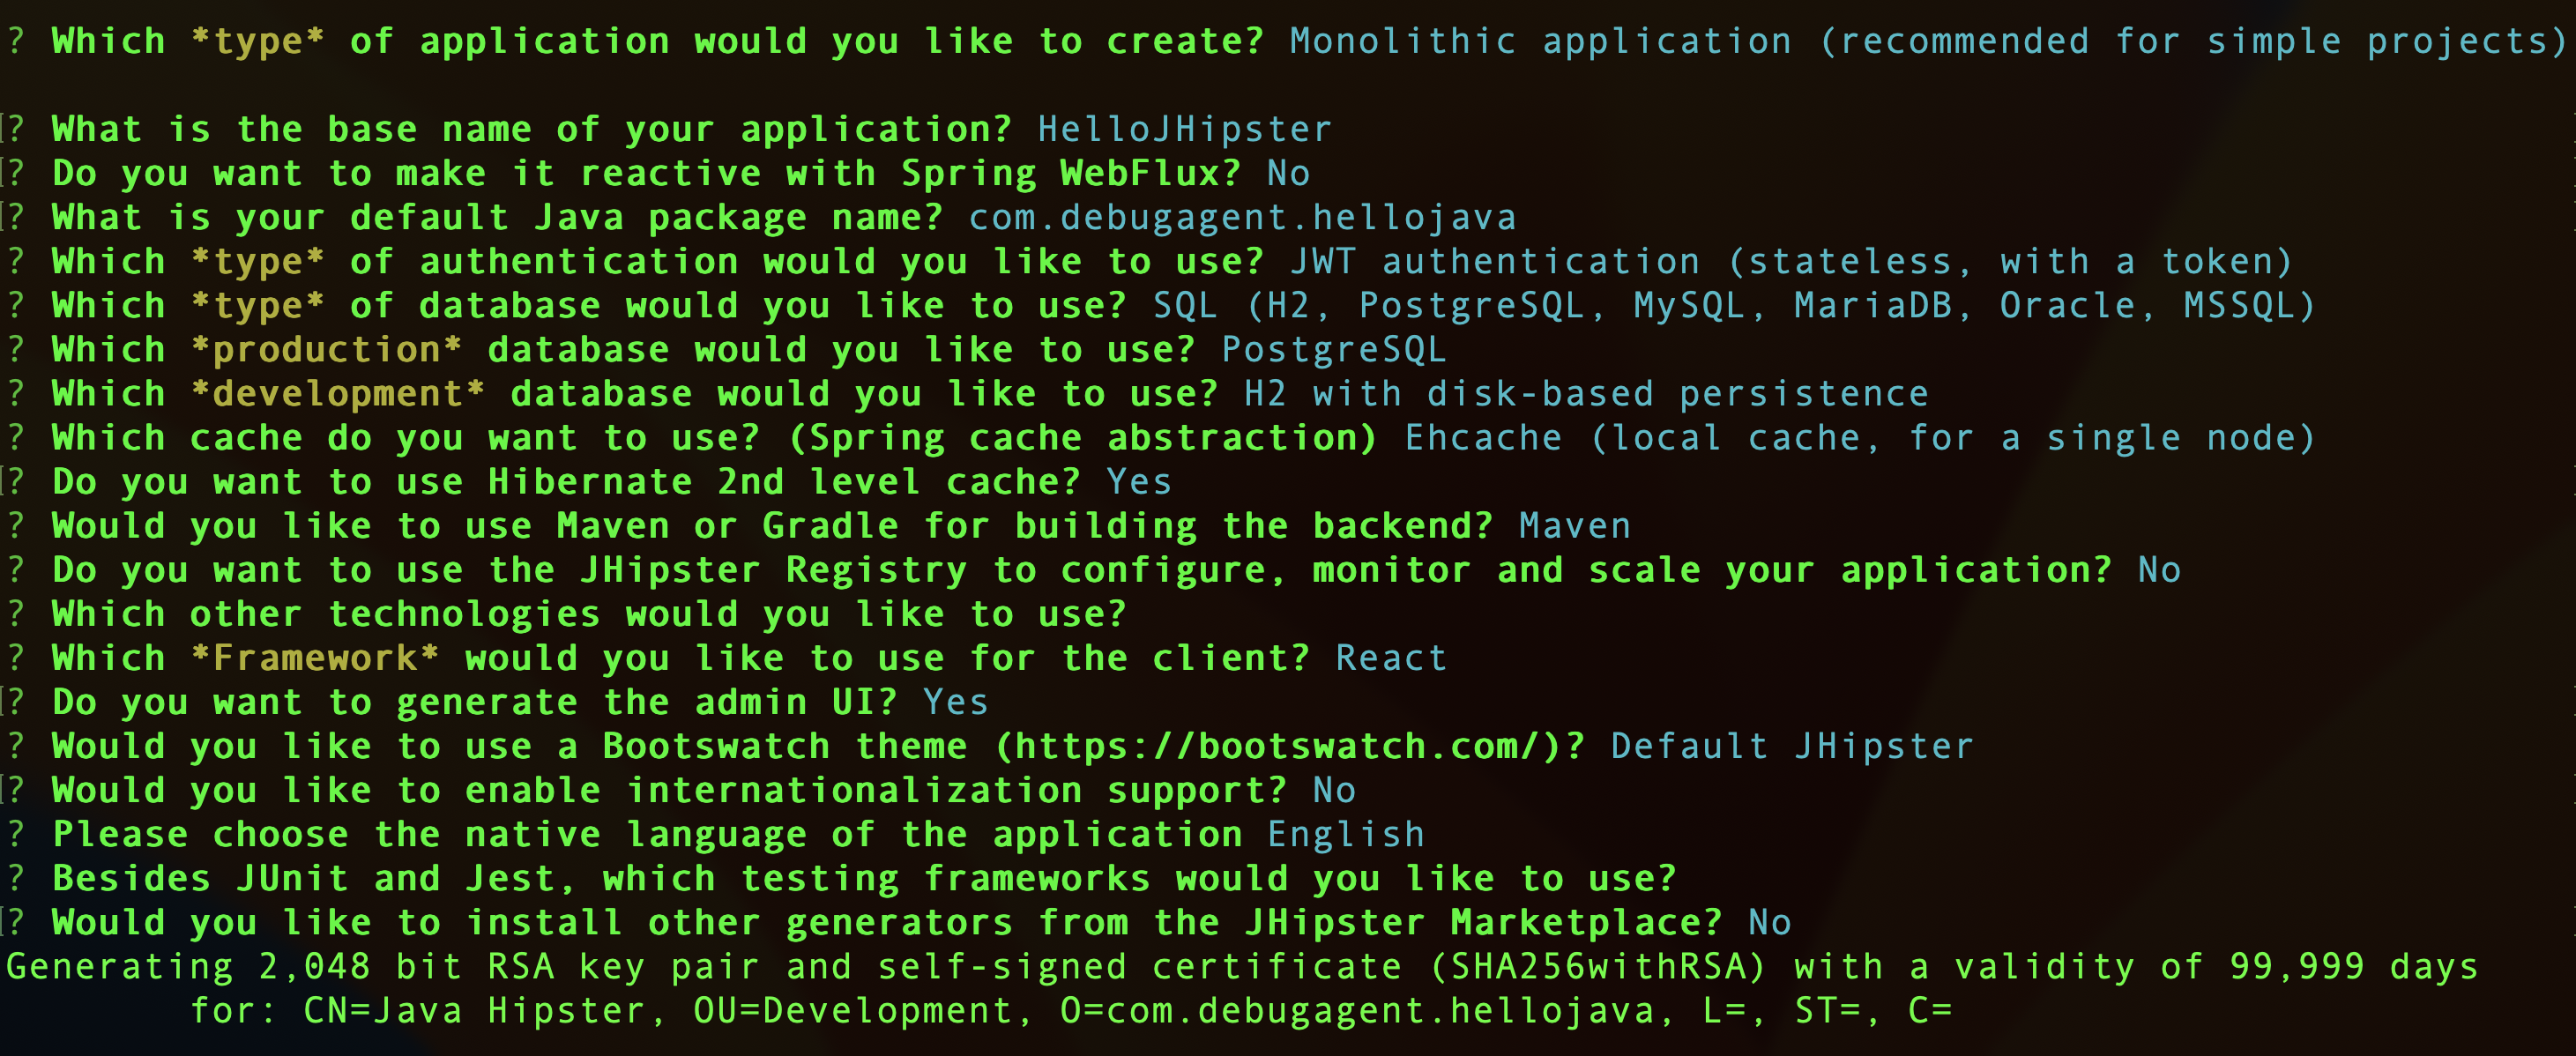
I created a separate project that demonstrates the use of GitHub Actions here. Notice you can follow this with any project, although we include maven instructions in this case, the concept is very simple. Once the project is created, we can open the project page on GitHub and move to the actions tab. We will see something like this:
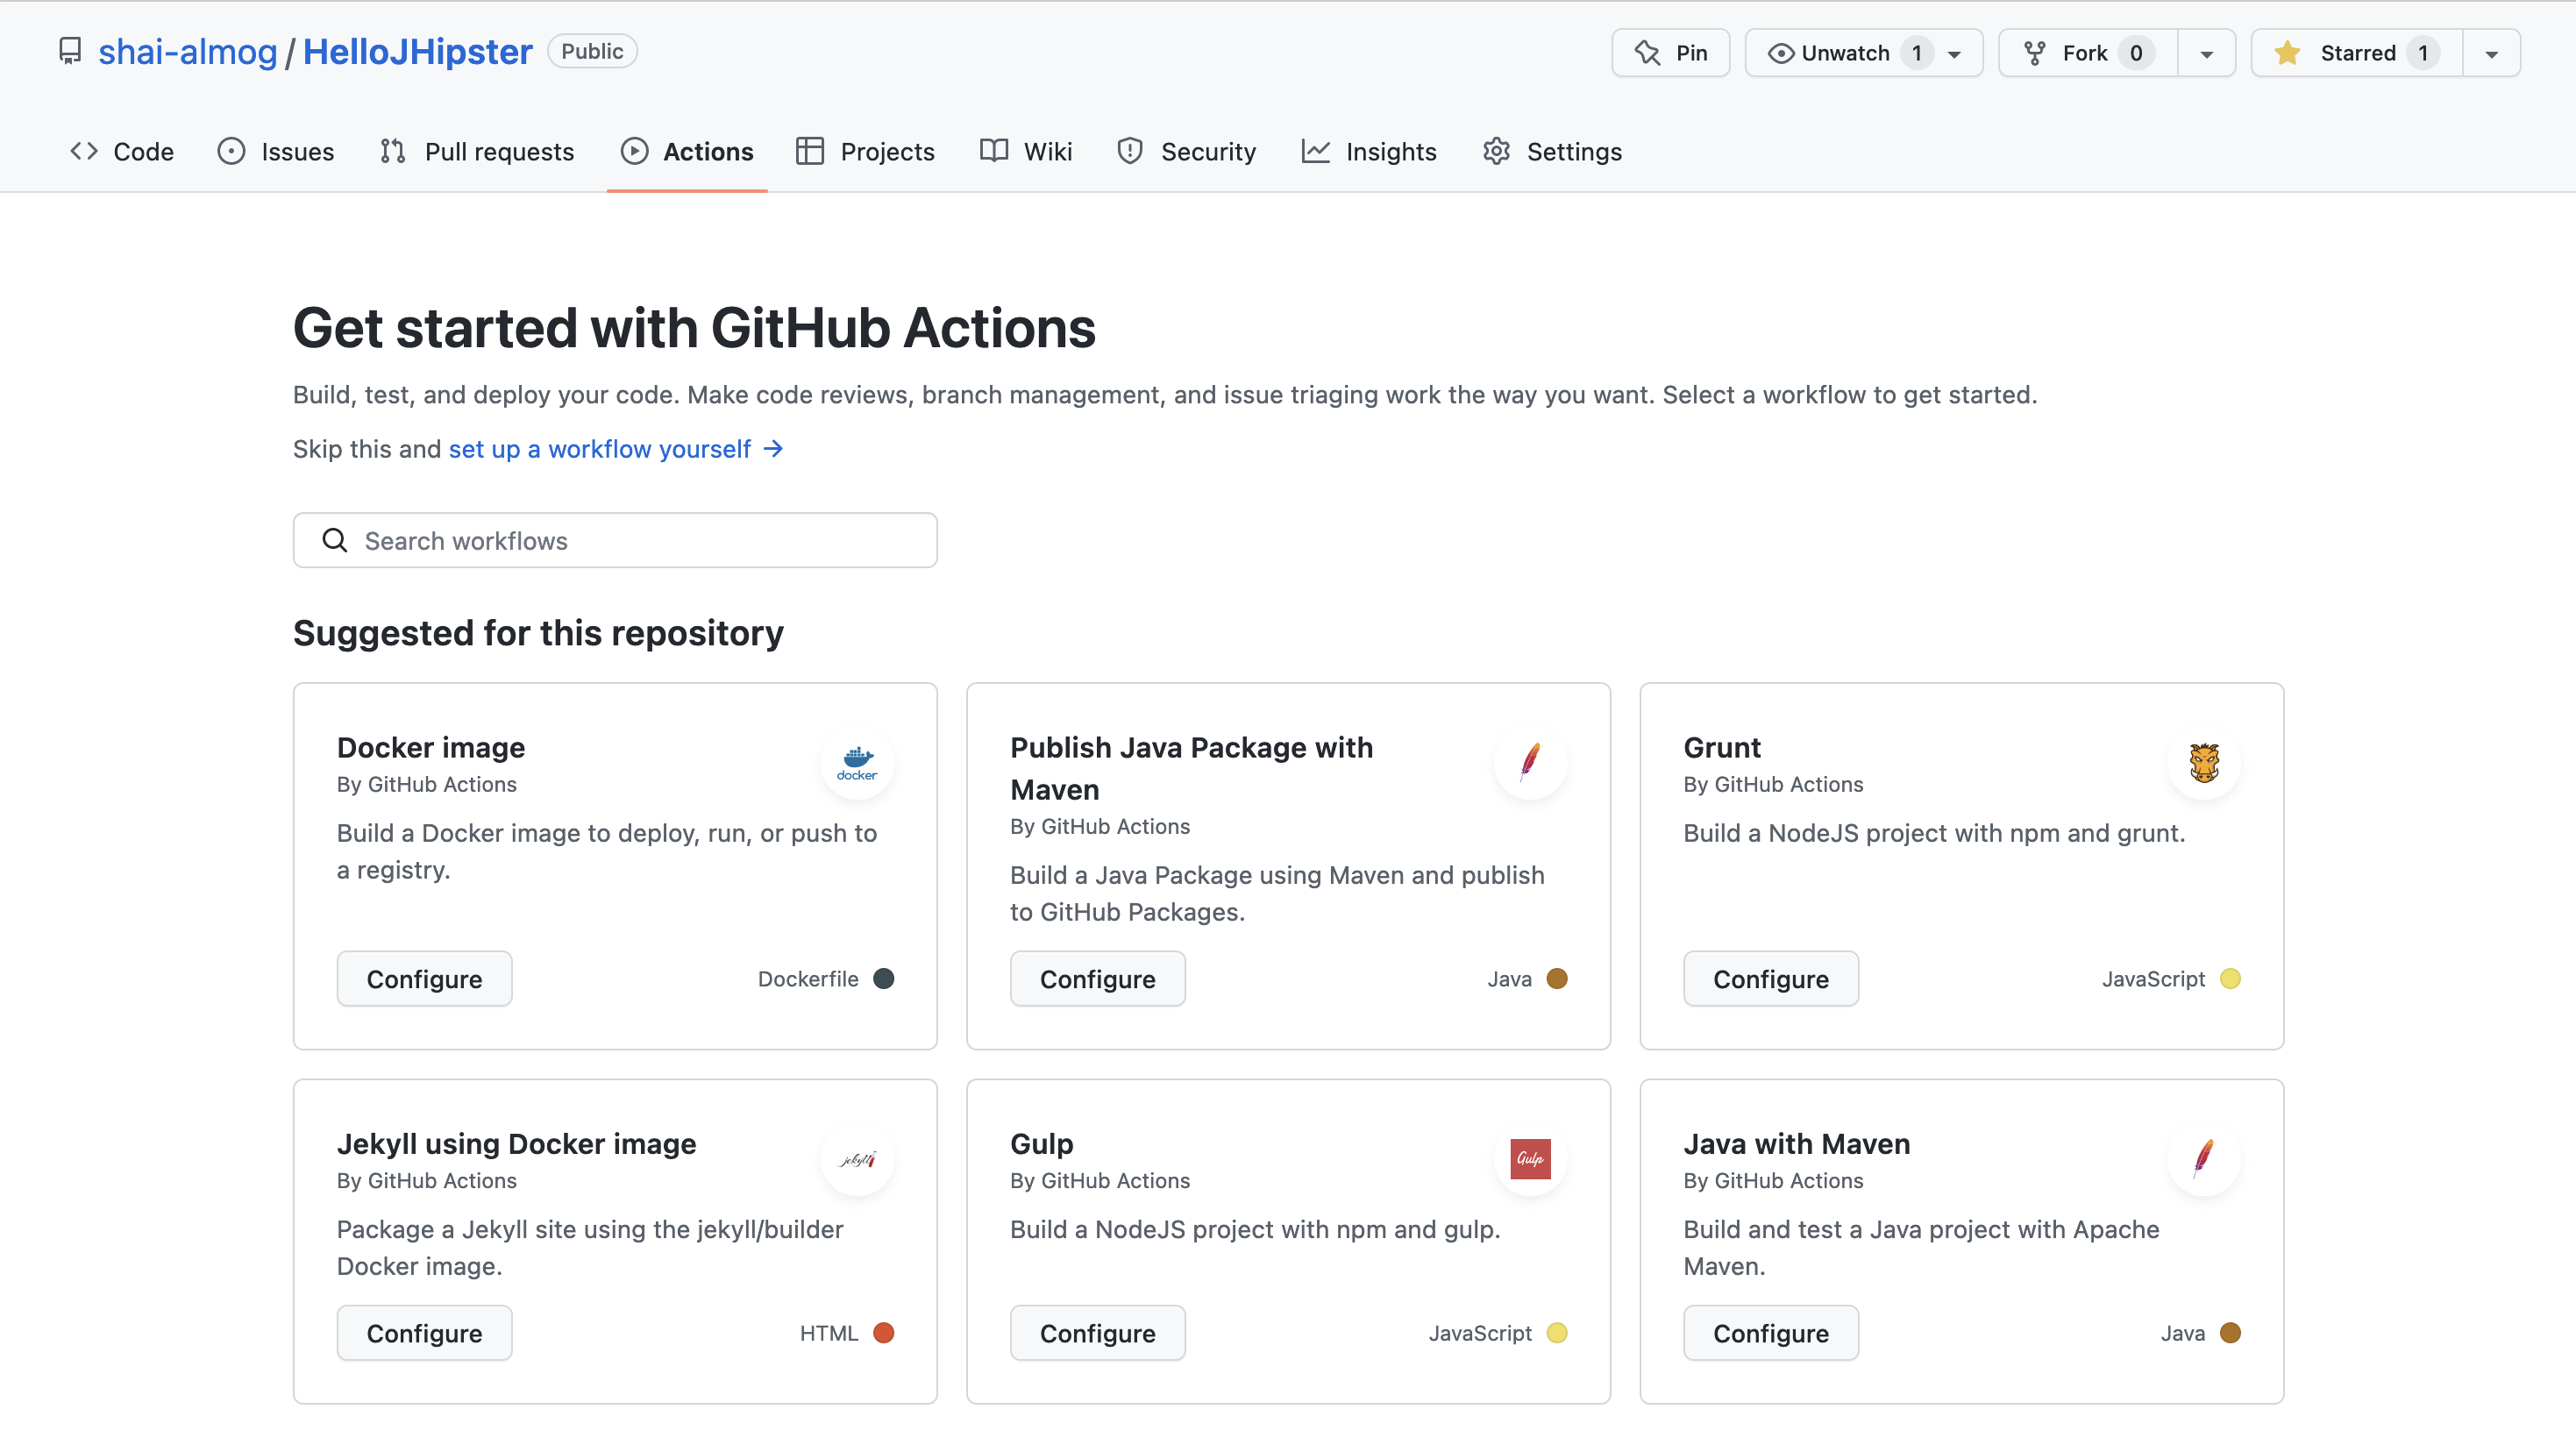
In the bottom right corner, we can see the Java with Maven project type. Once we pick this type, we move to the creation of a maven.yml file as shown here:
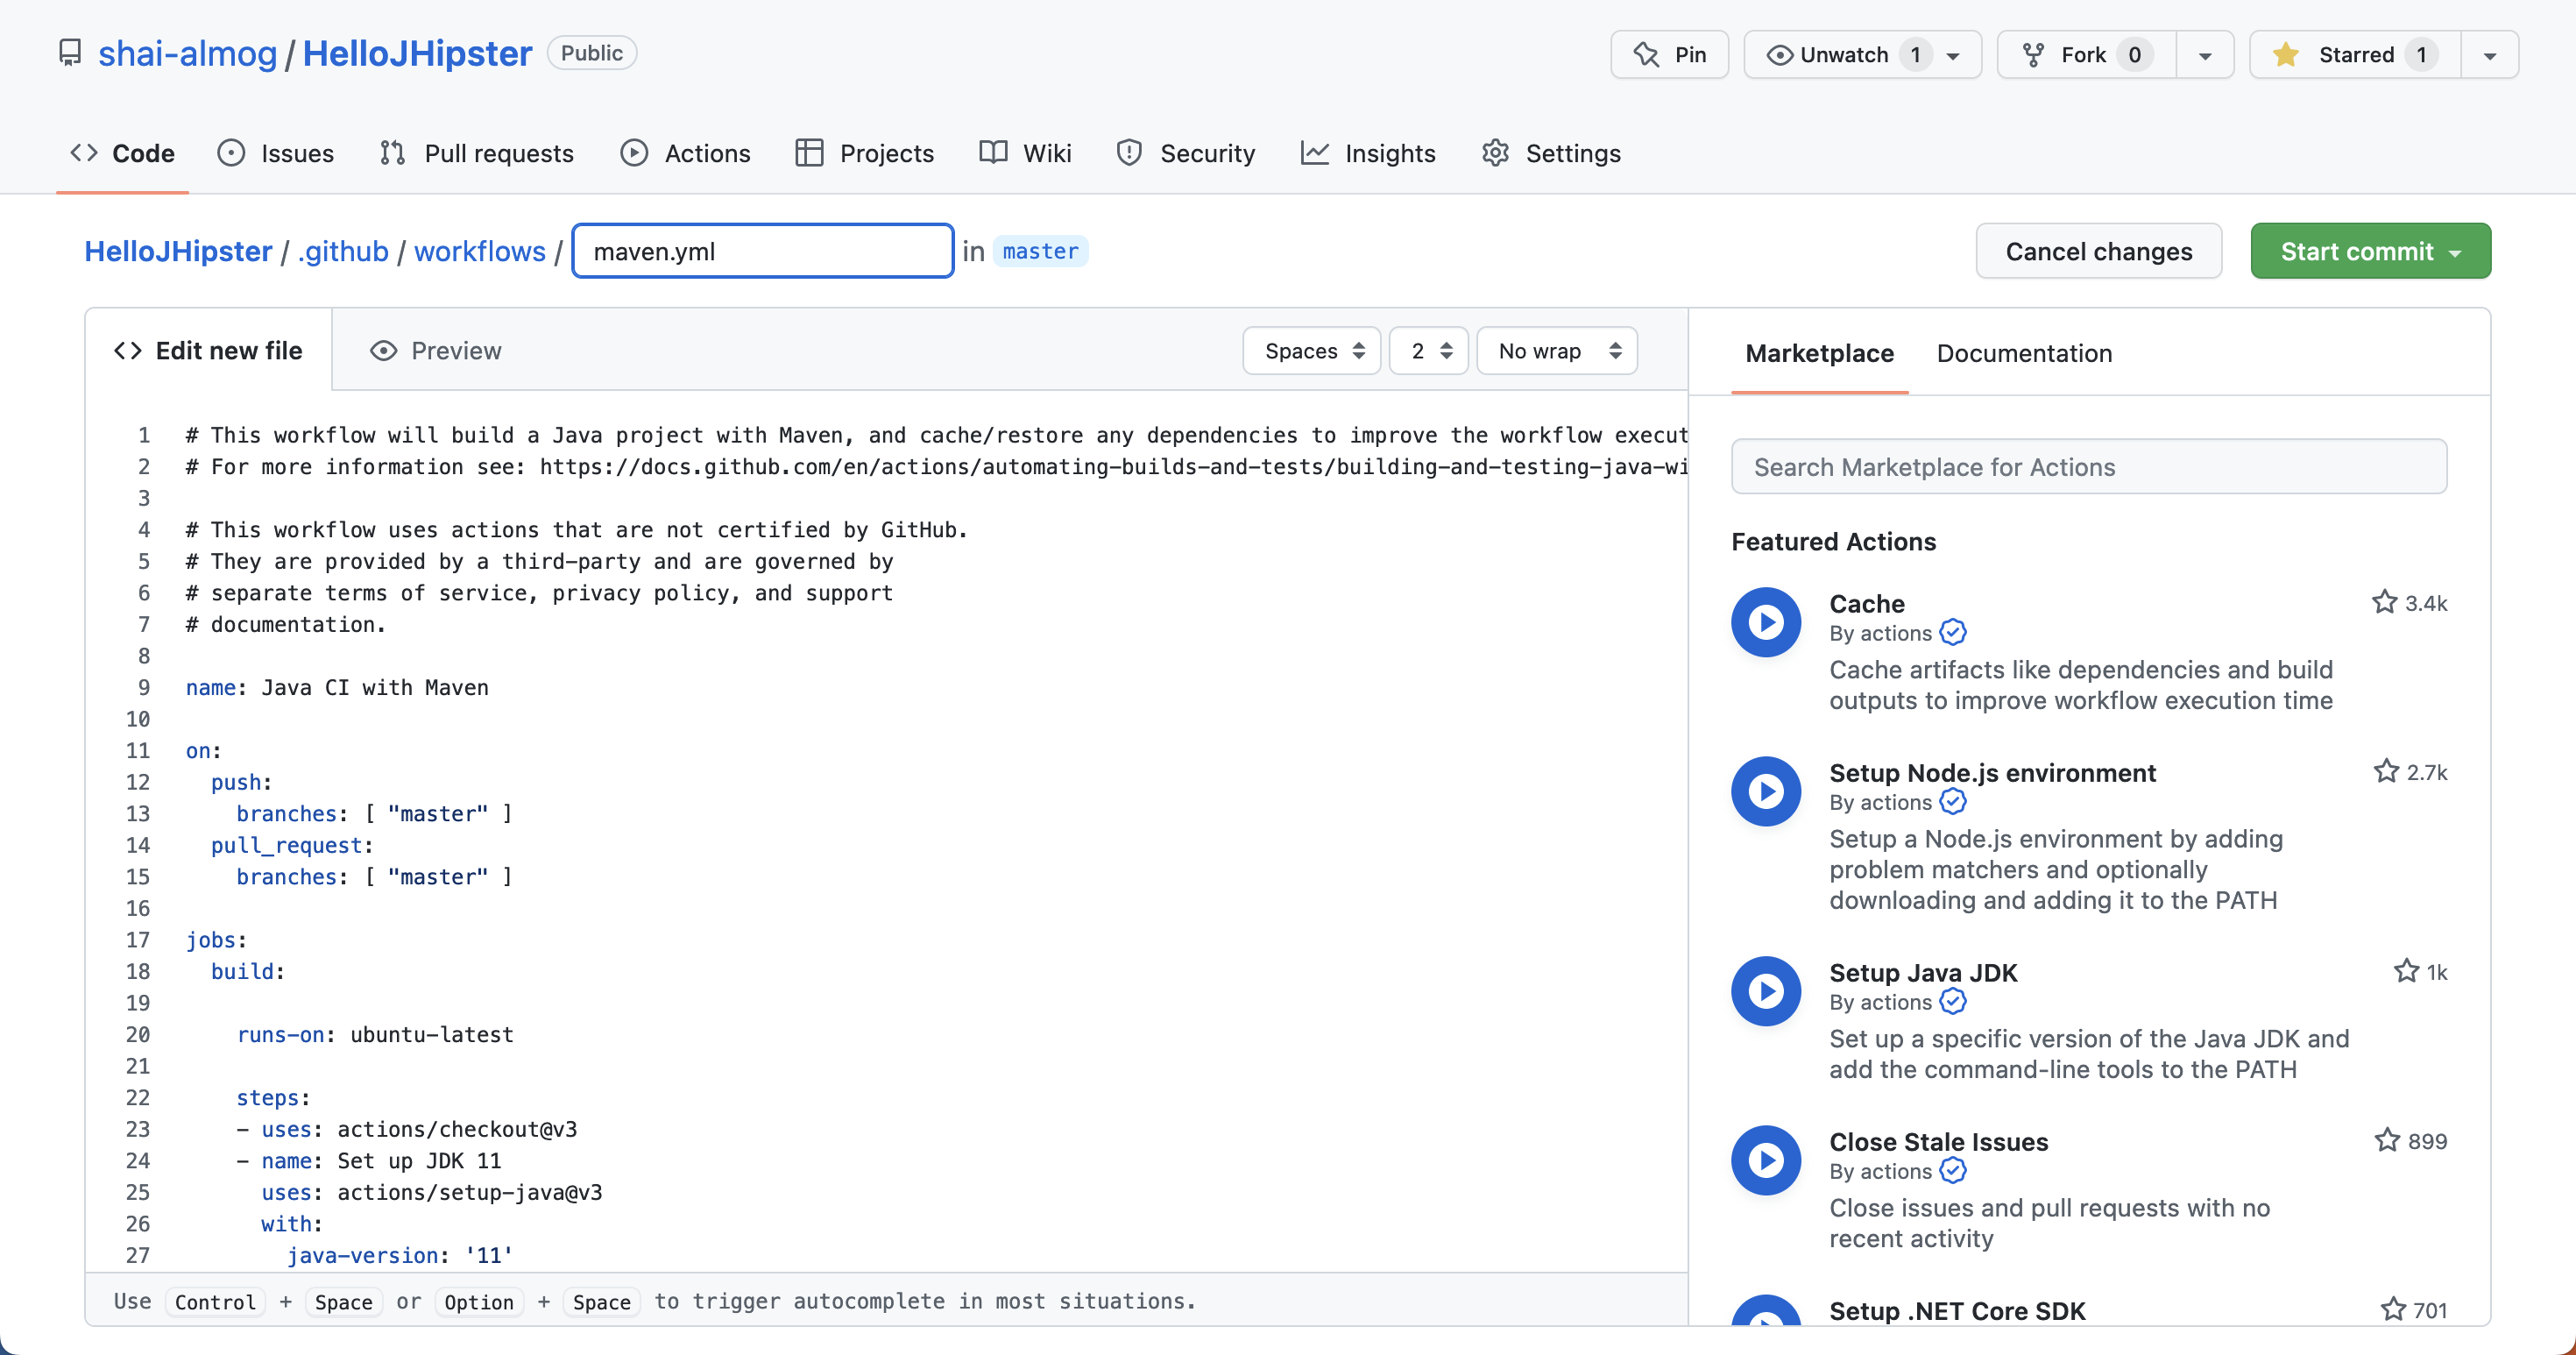
Unfortunately, the default maven.yml suggested by GitHub includes a problem. This is the code we see in this image:
name: Java CI with Maven

on:
  push:
    branches: [ "master" ]
  pull_request:
    branches: [ "master" ]

jobs:
  build:

    runs-on: ubuntu-latest

    steps:
    - uses: actions/checkout@v3
    - name: Set up JDK 11
      uses: actions/setup-java@v3
      with:
        java-version: '11'
        distribution: 'temurin'
        cache: maven
    - name: Build with Maven
      run: mvn -B package --file pom.xml

    # Optional: Uploads the full dependency graph to GitHub to improve the quality of Dependabot alerts this repository can receive
    - name: Update dependency graph
      uses: advanced-security/maven-dependency-submission-action@571e99aab1055c2e71a1e2309b9691de18d6b7d6
The last three lines update the dependency graph. But this feature fails or at least it failed for me. Removing them solved the problem. The rest of the code is standard YAML configuration.
The pull_request and push lines near the top of the code, declare that builds will run on both a pull request and a push to the master. This means we can run our tests on a pull request before committing. If the test fails, we will not commit. We can disallow committing with failed tests in the project settings. Once we commit the YAML file, we can create a pull request and the system will run the build process for us. This includes running the tests, since the “package” target in maven runs tests by default. The code that invokes the tests is in the line starting with “run” near the end. This is effectively a standard unix command line. Sometimes it makes sense to create a shell script and just run it from the CI process. It’s sometimes easier to write a good shell script than deal with all the YAML files and configuration settings of various CI stacks. It’s also more portable if we choose to switch the CI tool in the future. Here we don’t need it though since maven is enough for our current needs.
We can see the successful pull request here:
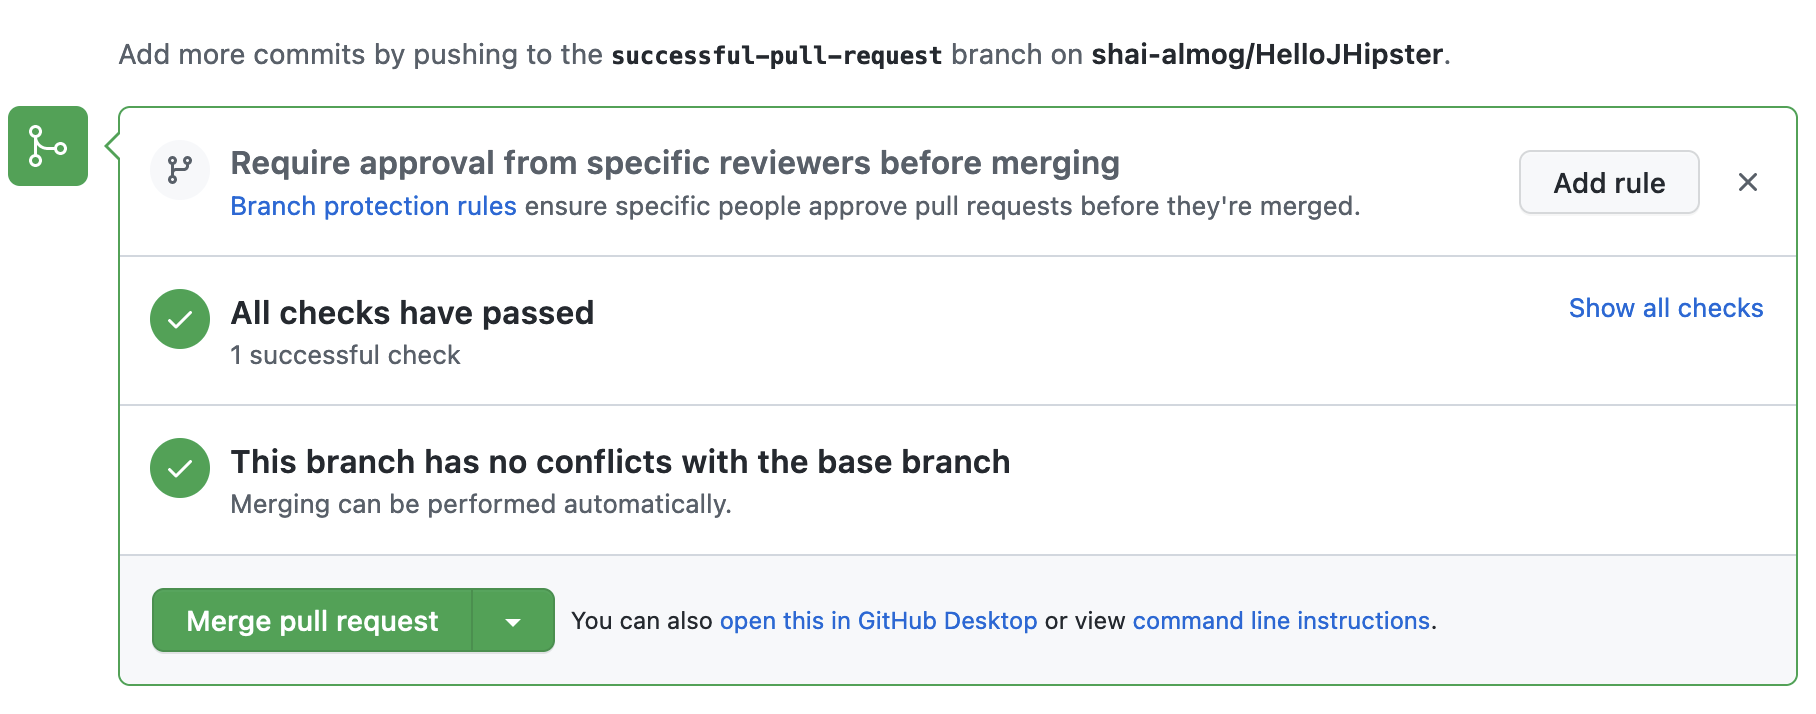
To test this out, we can add a bug to the code by changing the “/api” endpoint to “/myapi”. This produces the failure shown below. It also triggers an error email sent to the author of the commit.
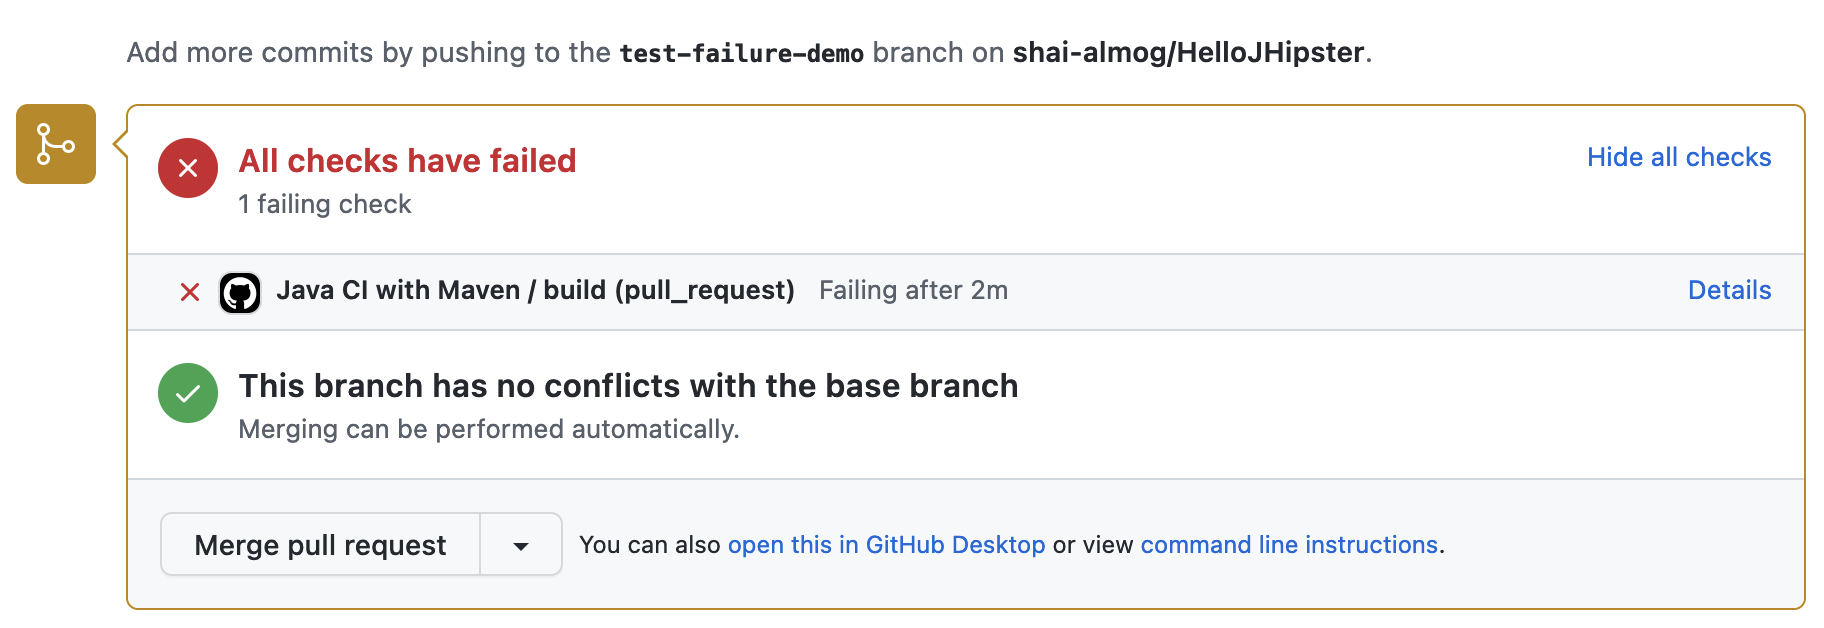
When such a failure occurs, we can click the “Details” link on the right side. This takes us directly to the error message you see here:
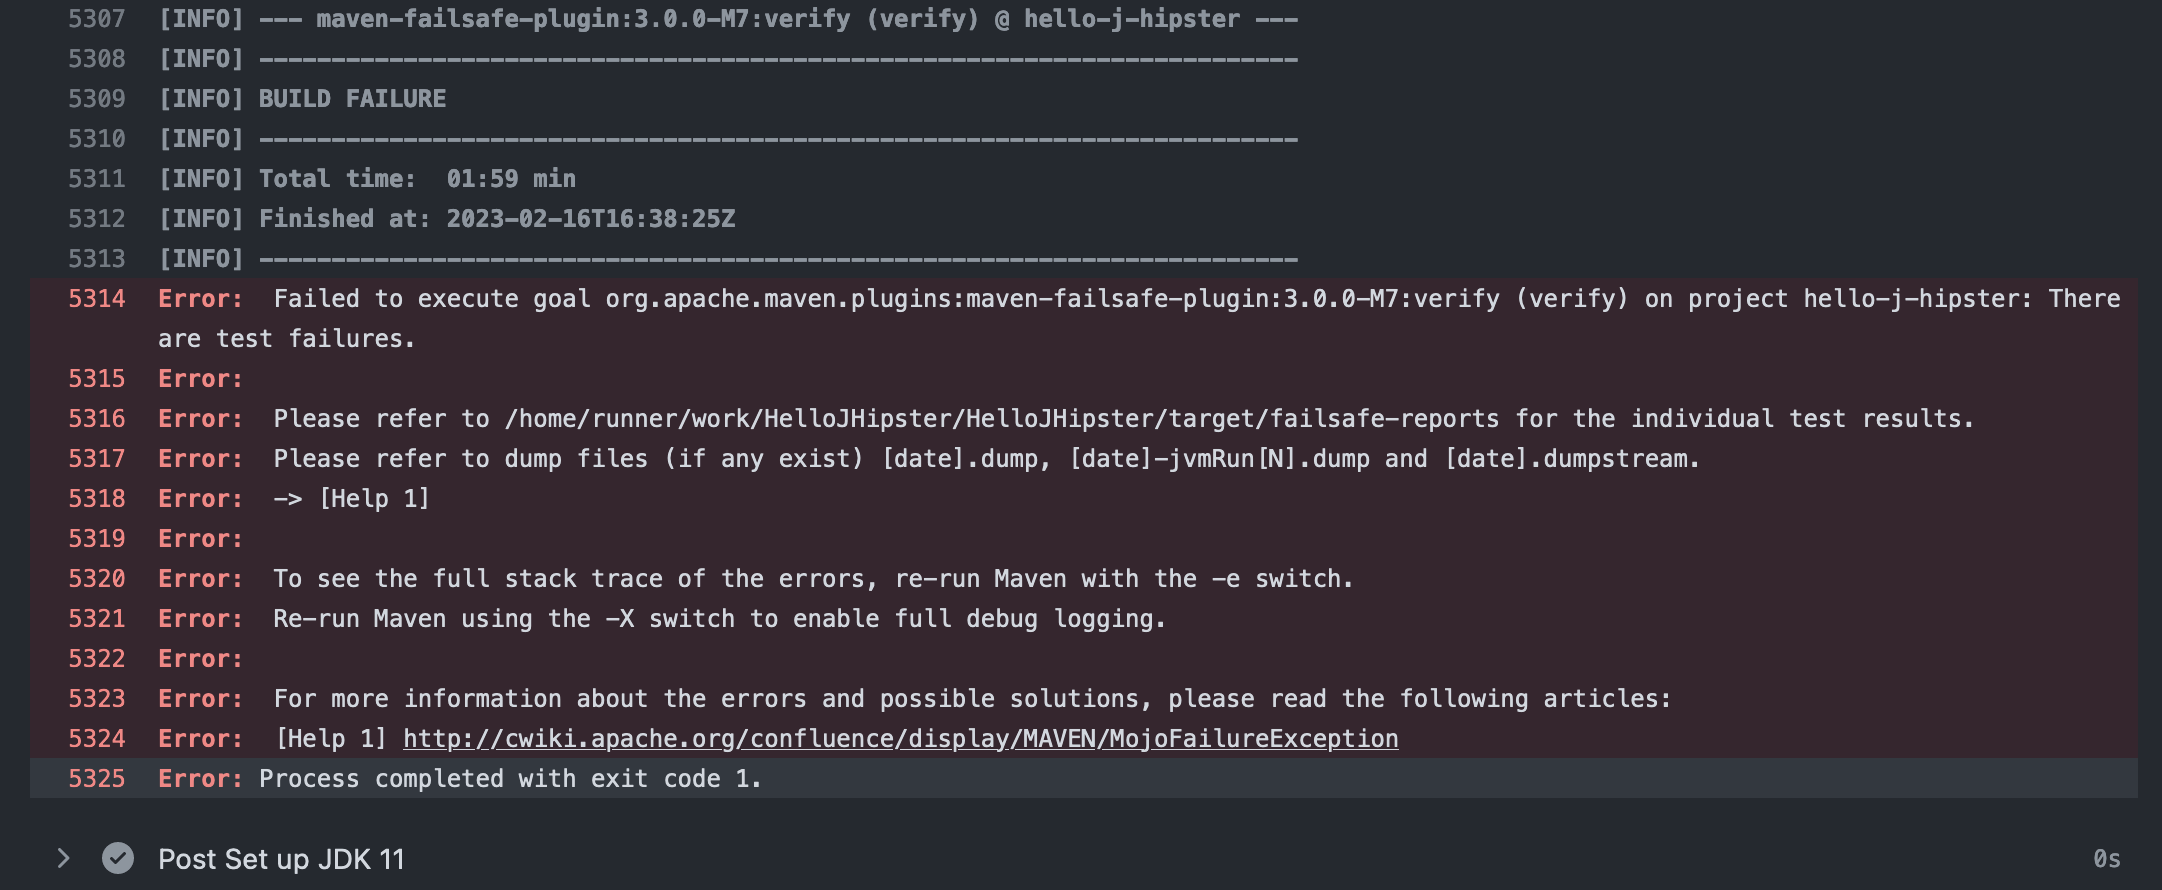
Unfortunately, this is typically a useless message that does not provide help in the issue resolution. However, scrolling up will show the actual failure which is usually conveniently highlighted for us as seen here:
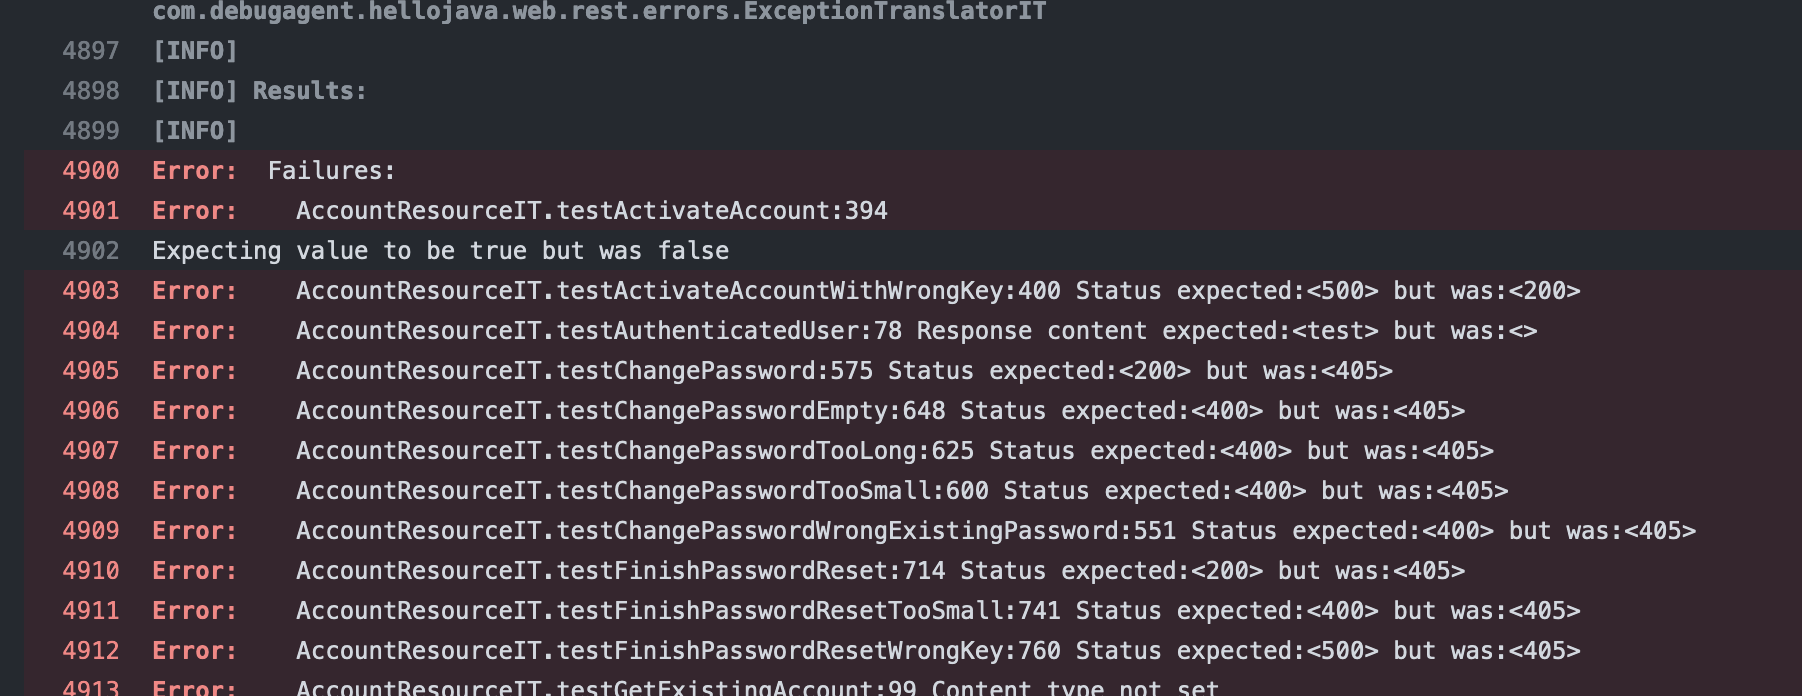
Note that there are often multiple failures so it would be prudent to scroll up further. In this error, we can see the failure was an assertion in line 394 of AccountResourceIT which you can see here, note that the line numbers do not match. In this case, line 394 is the last line of the method:
@Test
@Transactional
void testActivateAccount() throws Exception {
    final String activationKey = "some activation key";
    User user = new User();
    user.setLogin("activate-account");
    user.setEmail("activate-account@example.com");
    user.setPassword(RandomStringUtils.randomAlphanumeric(60));
    user.setActivated(false);
    user.setActivationKey(activationKey);

    userRepository.saveAndFlush(user);

    restAccountMockMvc.perform(get("/api/activate?key={activationKey}", activationKey)).andExpect(status().isOk());

    user = userRepository.findOneByLogin(user.getLogin()).orElse(null);
    assertThat(user.isActivated()).isTrue();
}
This means the assert call failed. isActivated() returned false and failed the test. This should help a developer narrow down the issue and understand the root cause.
Going Beyond
As we mentioned before CI is about developer productivity. We can go much further than merely compiling and testing. We can enforce coding standards, lint the code, detect security vulnerabilities and much more. In this example let’s integrate Sonar Cloud which is a powerful code analysis tool (linter). It finds potential bugs in your project and helps you improve code quality.
SonarCloud is a cloud-based version of SonarQube that allows developers to continuously inspect and analyze their code to find and fix issues related to code quality, security, and maintainability. It supports various programming languages such as Java, C#, JavaScript, Python, and more. SonarCloud integrates with popular development tools such as GitHub, GitLab, Bitbucket, Azure DevOps, and more. Developers can use SonarCloud to get real-time feedback on the quality of their code and improve the overall code quality.
On the other hand, SonarQube is an open-source platform that provides static code analysis tools for software developers. It provides a dashboard that shows a summary of the code quality and helps developers to identify and fix issues related to code quality, security, and maintainability.
Both SonarCloud and SonarQube provide similar functionalities, but SonarCloud is a cloud-based service and requires a subscription, while SonarQube is an open-source platform that can be installed on-premise or on a cloud server. For simplicity's sake, we will use SonarCloud but SonarQube should work just fine. To get started we go to sonarcloud.io, and sign up. Ideally with our GitHub account. We are then presented with an option to add a repository for monitoring by Sonar Cloud as shown here:

When we select the Analyze new page option, we need to authorize access to our GitHub repository. The next step is selecting the projects we wish to add to Sonar Cloud as shown here:
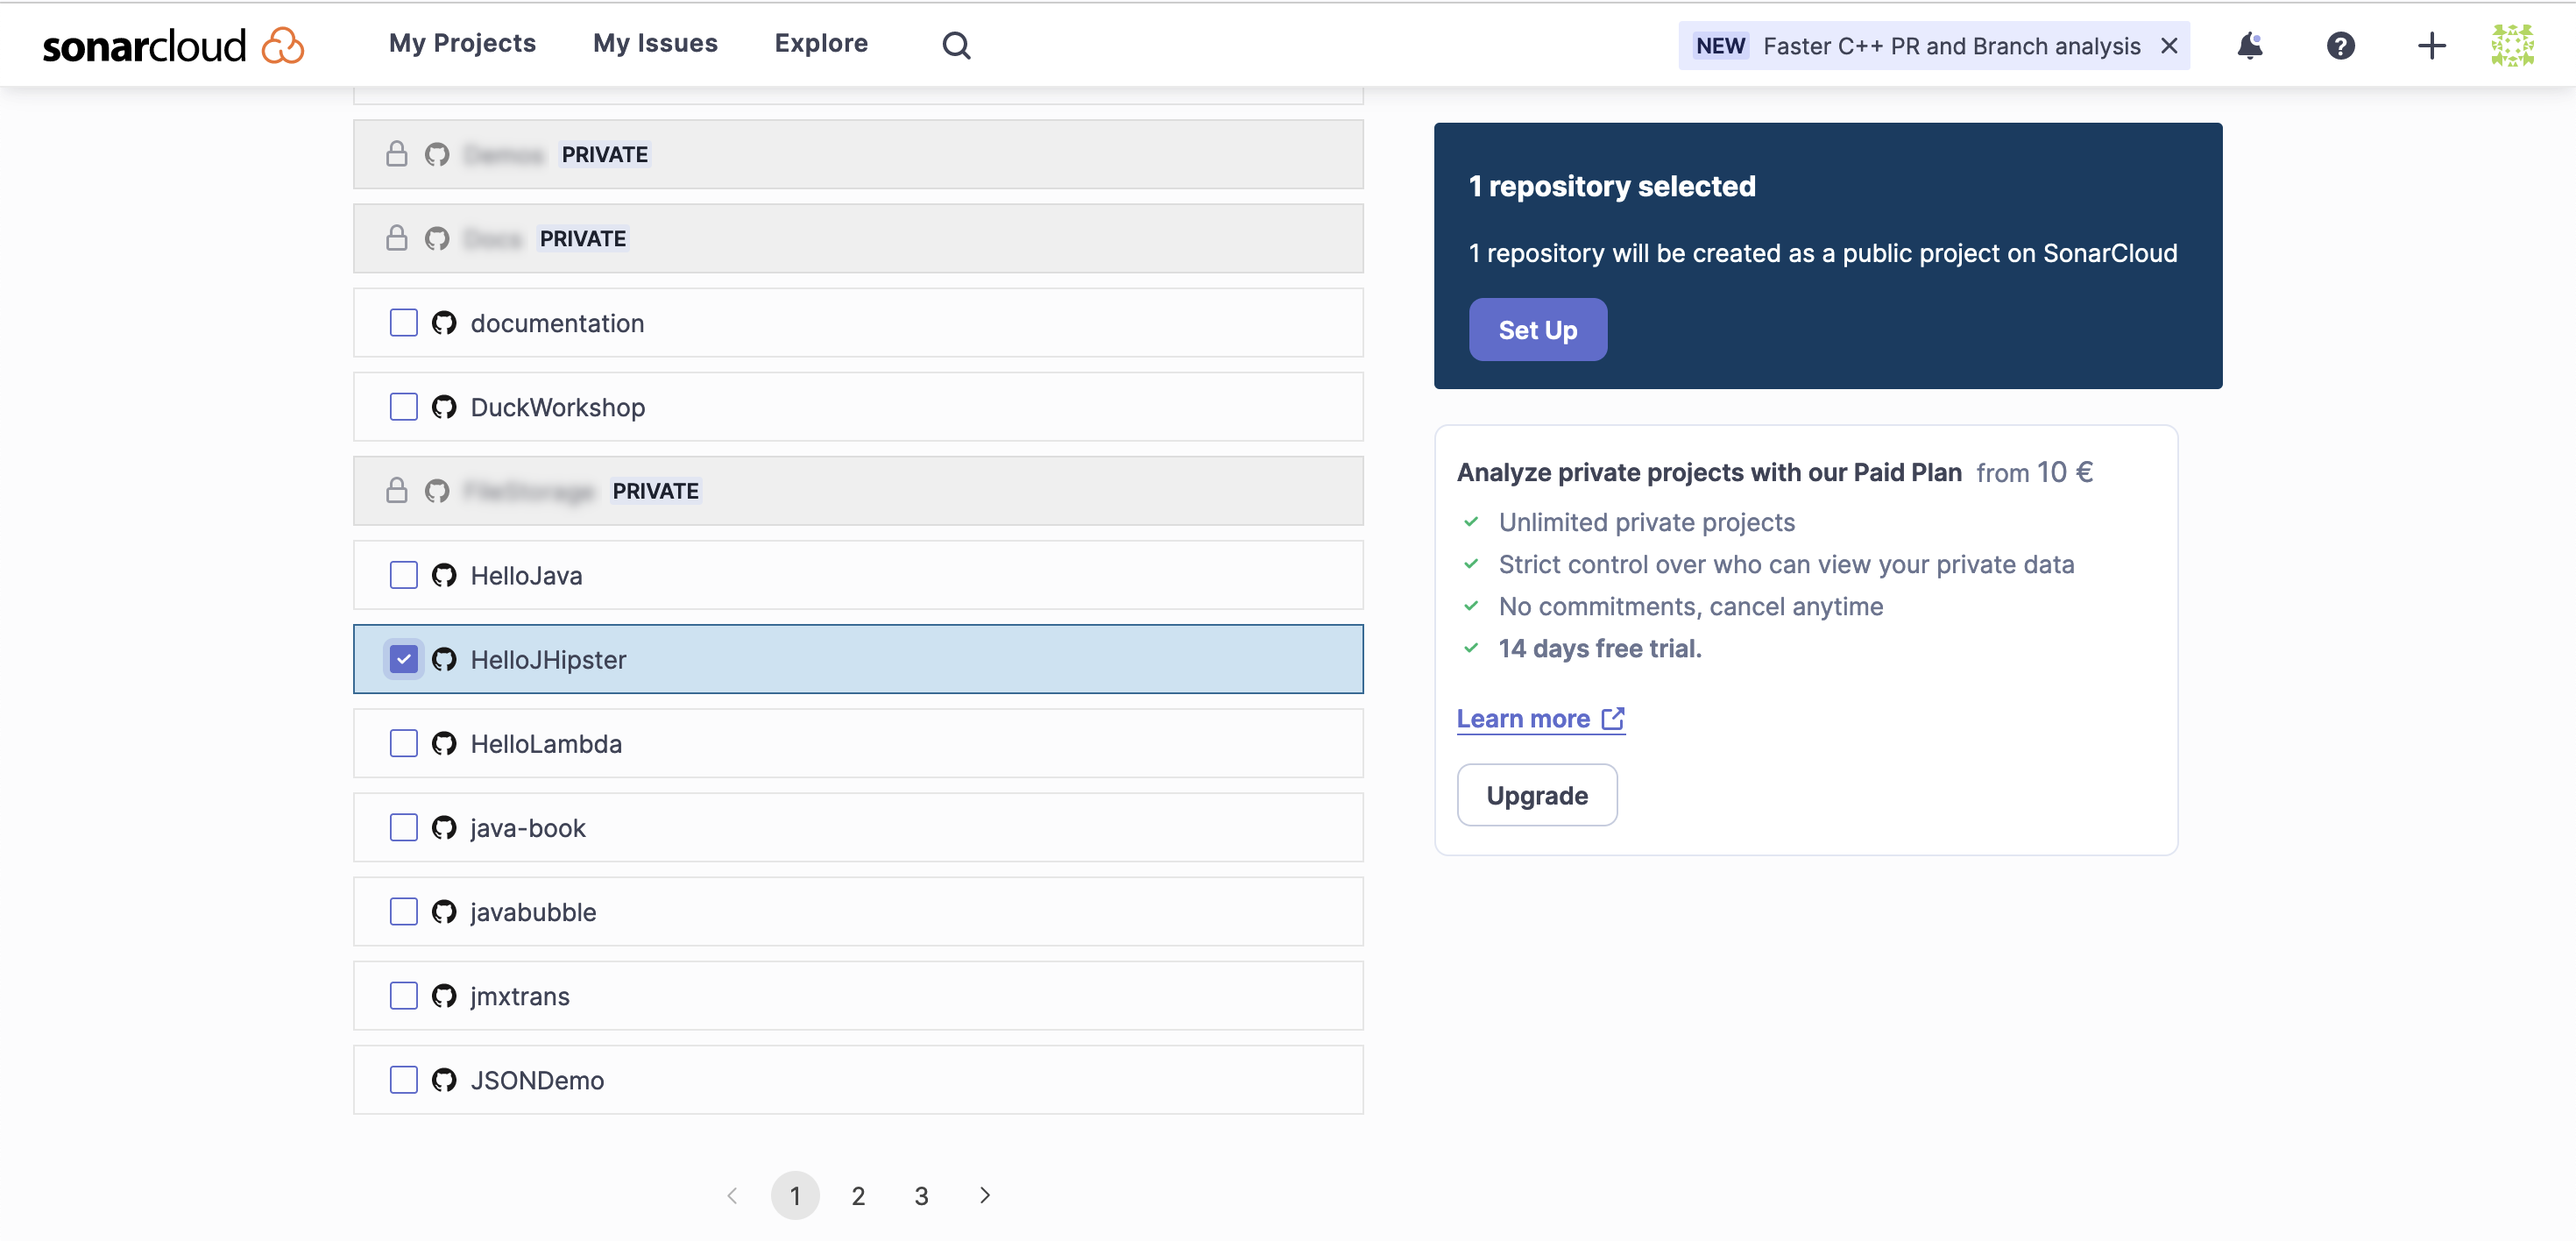
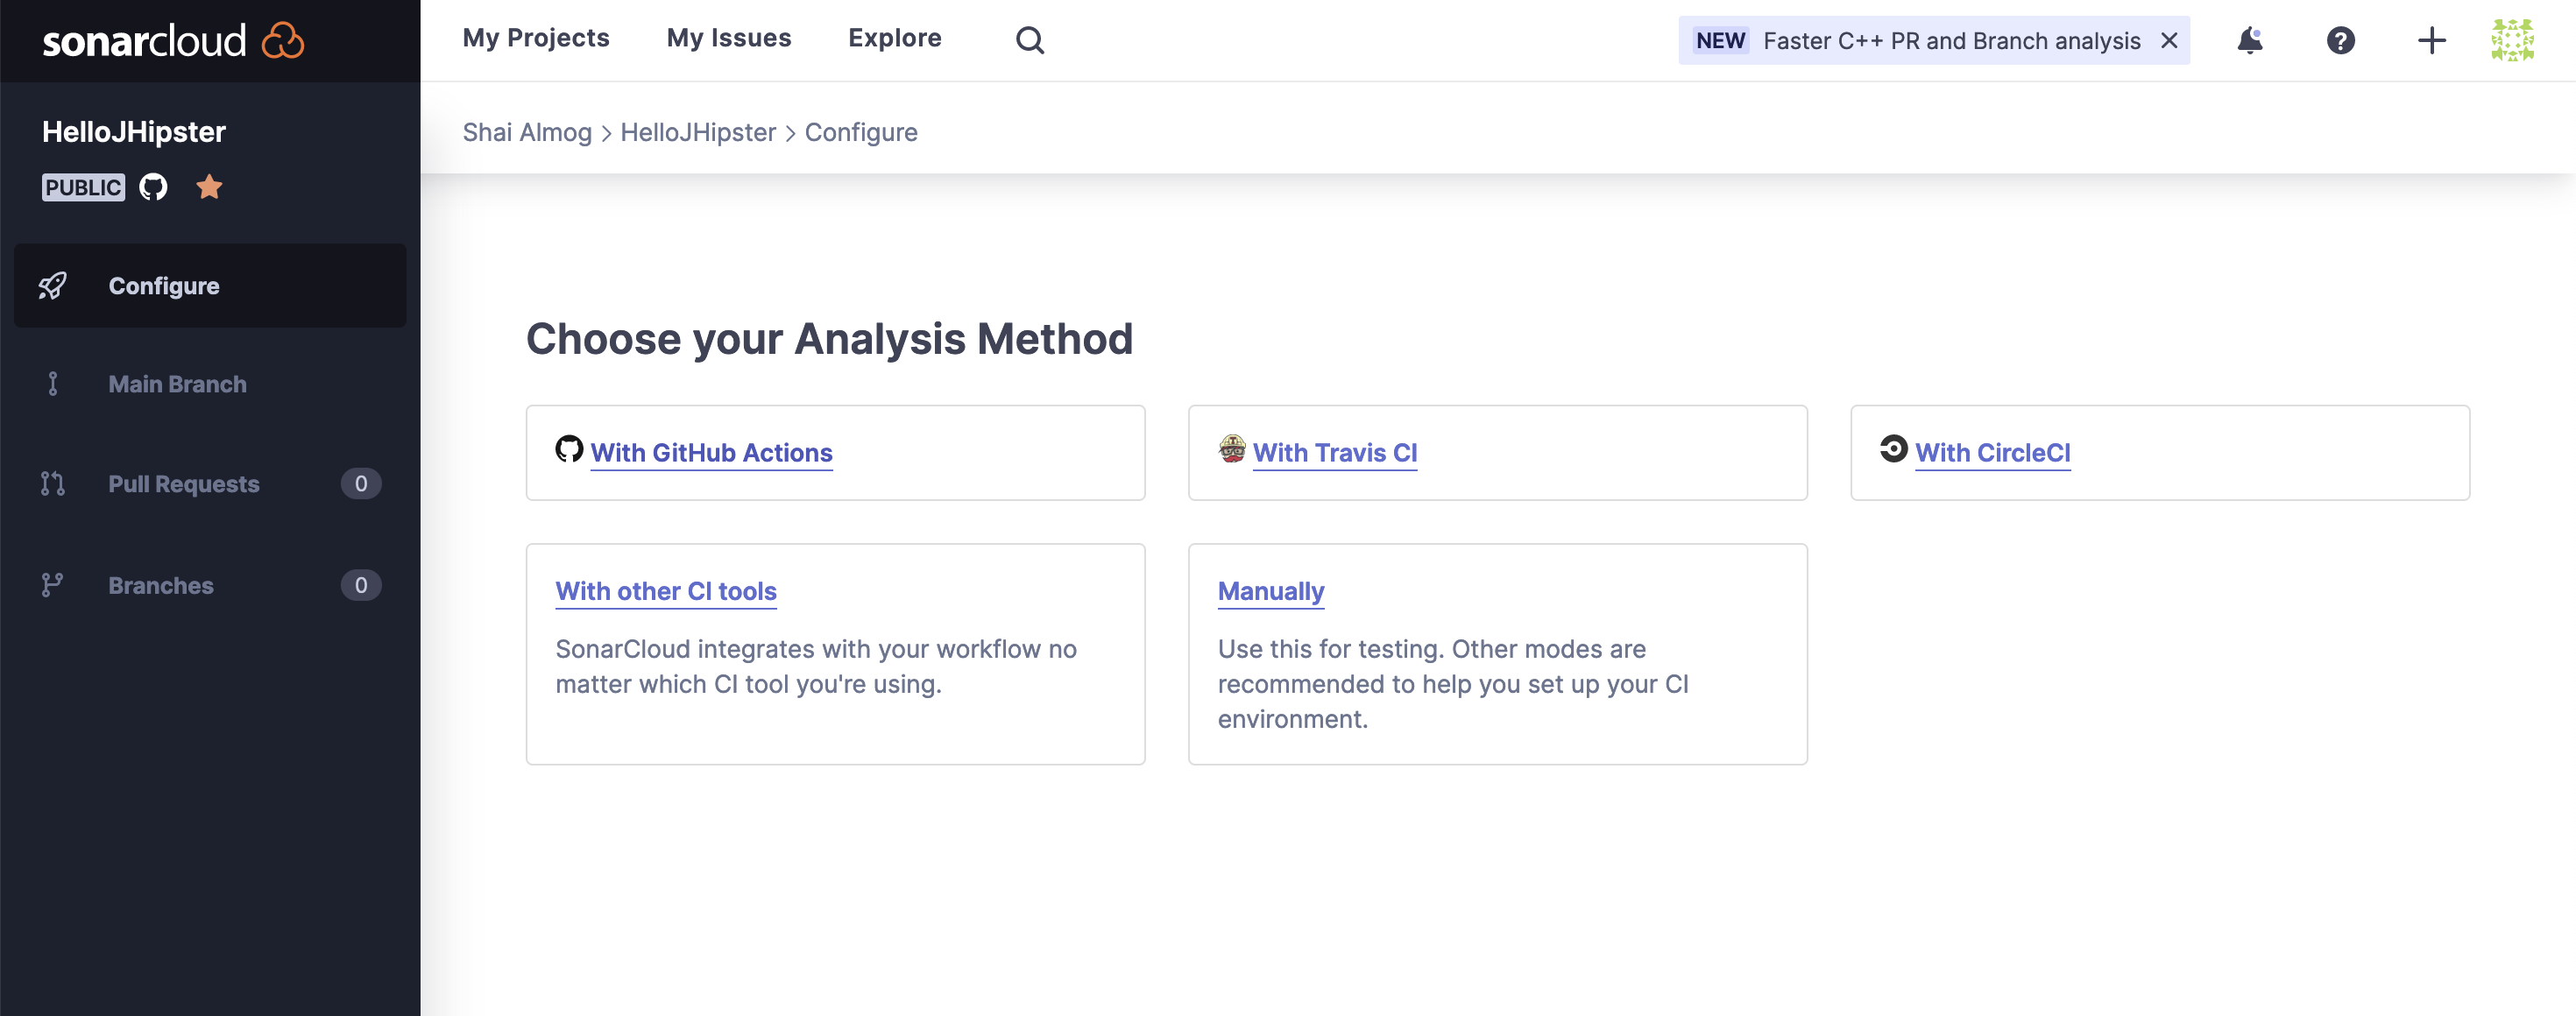
Once we select and proceed to the setup process, we need to pick the analysis method. Since we use GitHub Actions, we need to pick that option in the following stage as seen here:
Once this is set, we enter the final stage within the Sonar Cloud wizard as seen in the following image. We receive a token that we can copy (entry 2 that is blurred in the image), we will use that shortly. Notice there are also default instructions to use with maven that appear once you click the button labeled “Maven”.
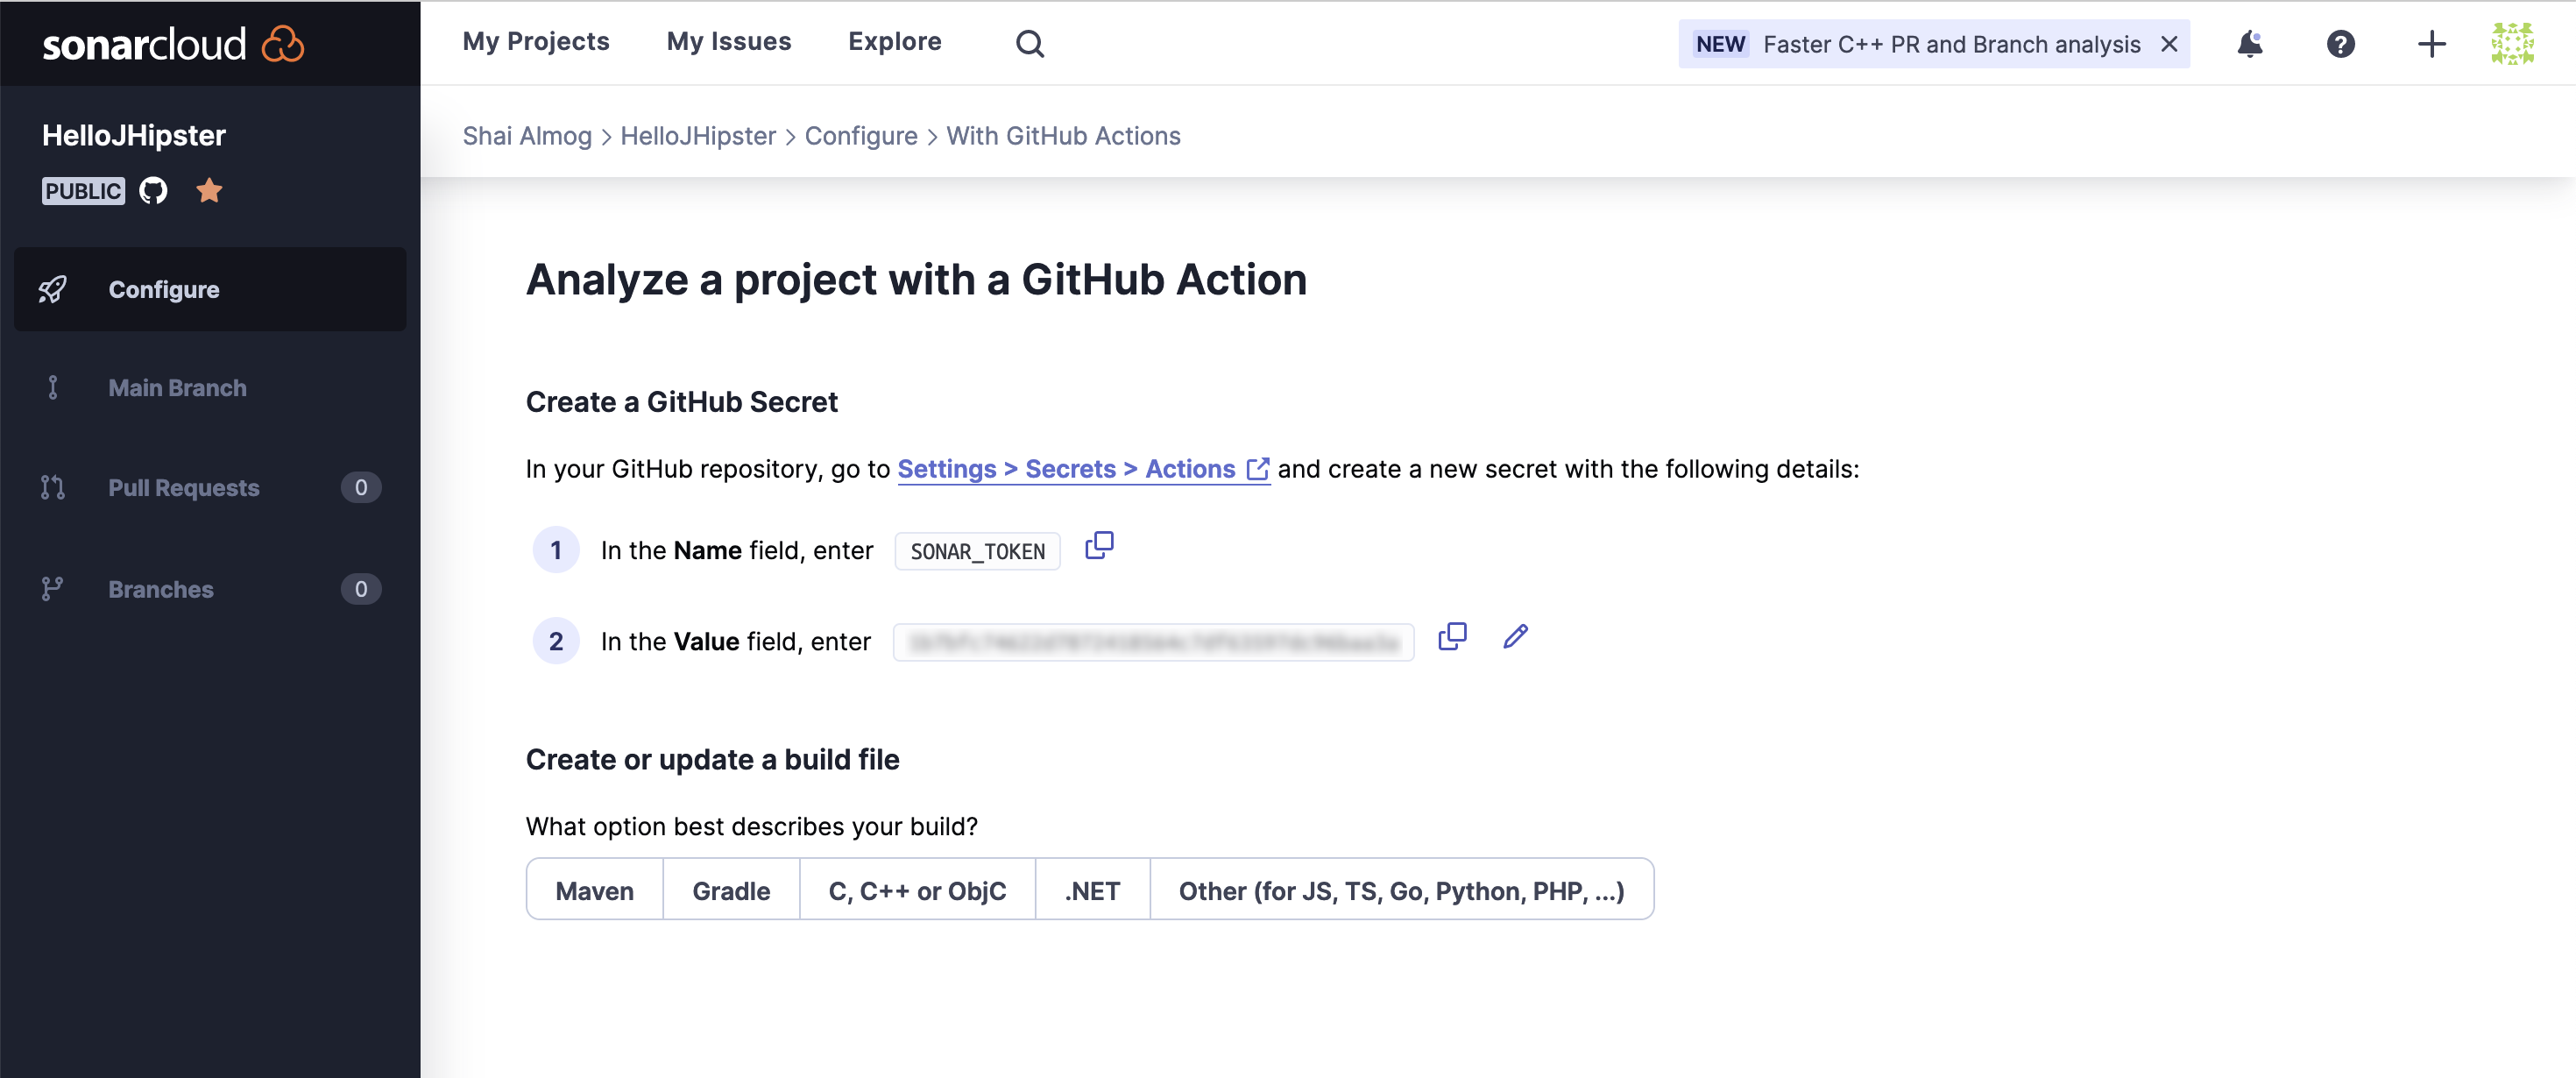
Going back to the project in GitHub we can move to the project settings tab (not to be confused with the account settings in the top menu). Here we select “Secrets and variables” as shown here:
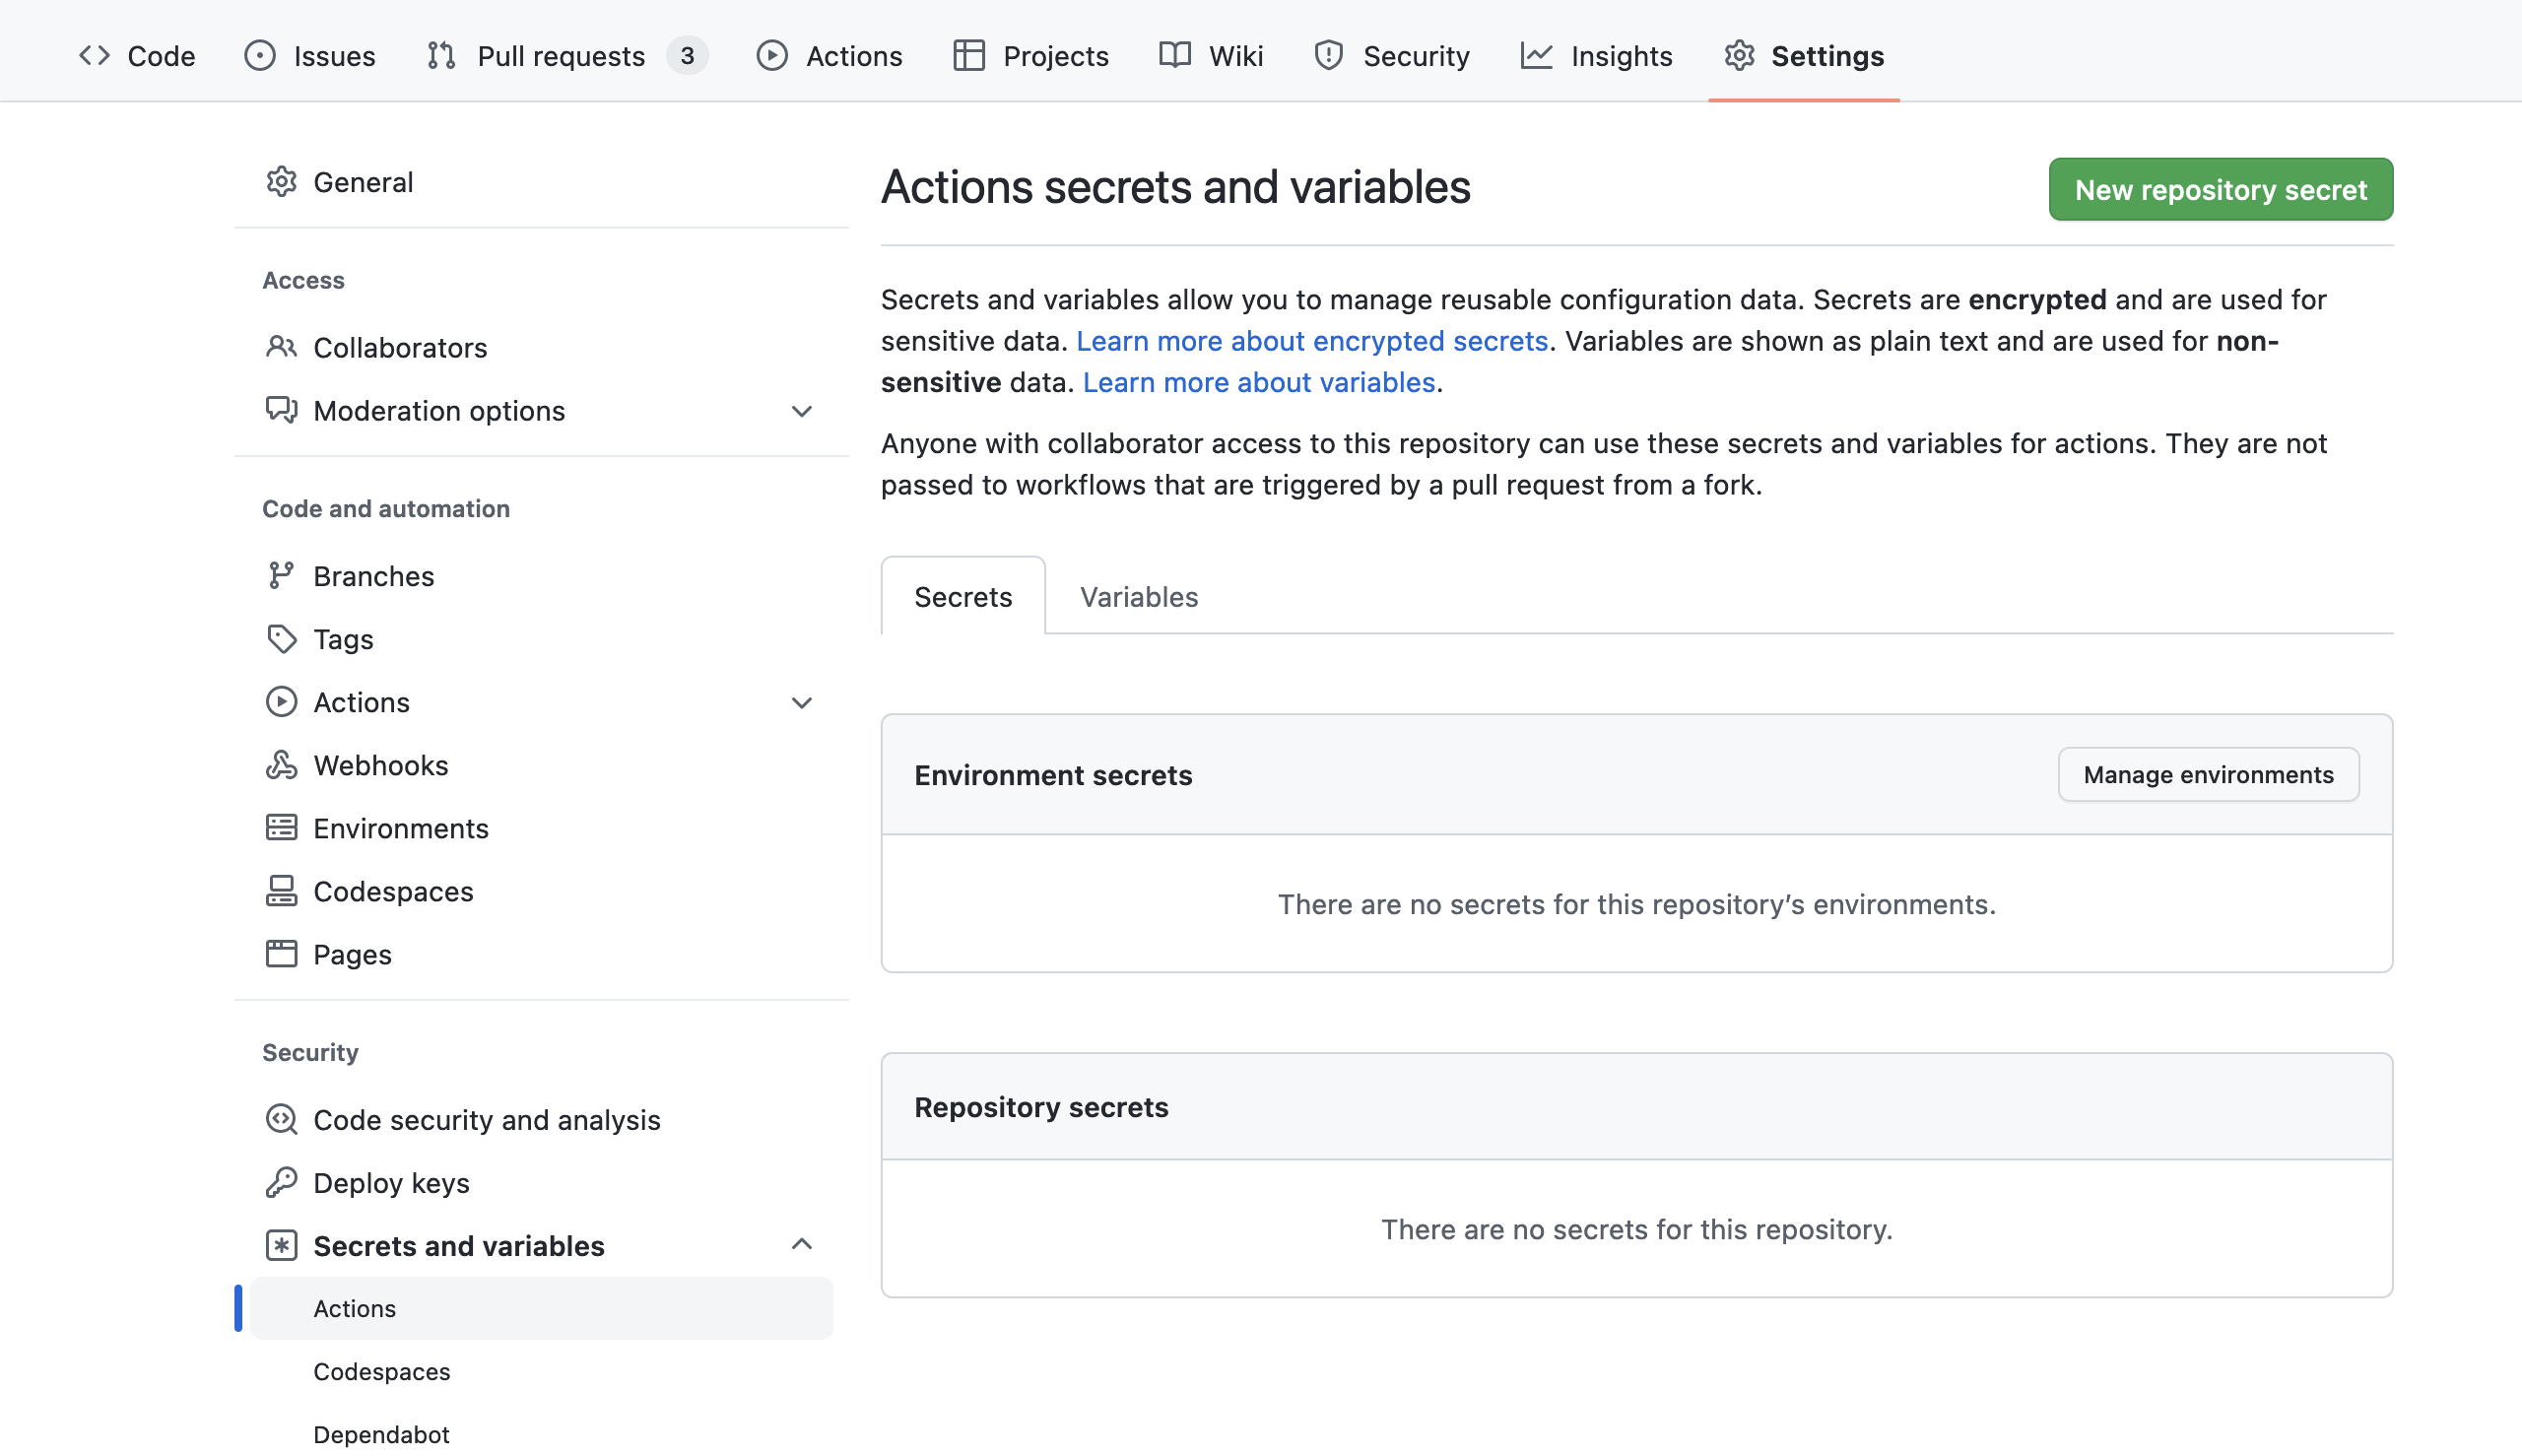
In this section we can add a new repository secret, specifically the SONAR_TOKEN key and value we copied from the SonarCloud as you can see here:
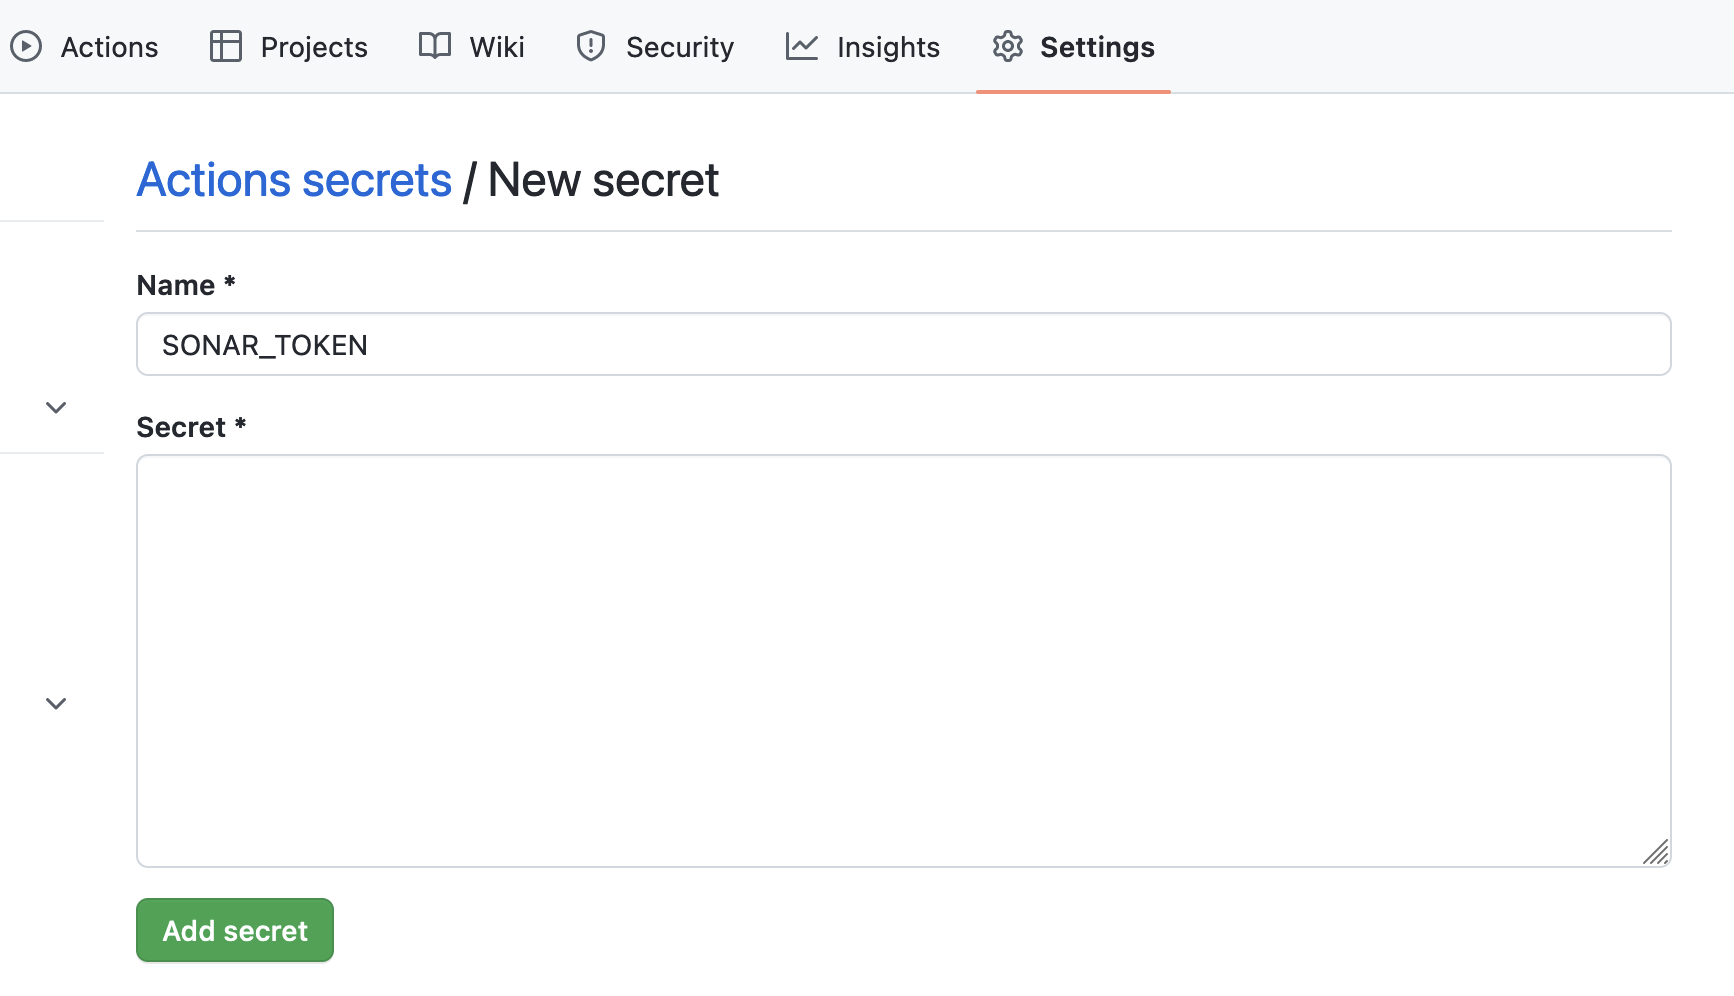
GitHub Repository Secrets are a feature that allows developers to securely store sensitive information associated with a GitHub repository, such as API keys, tokens, and passwords, which are required to authenticate and authorize access to various third-party services or platforms used by the repository.
The concept behind GitHub Repository Secrets is to provide a secure and convenient way to manage and share confidential information, without having to expose the information publicly in code or configuration files. By using secrets, developers can keep sensitive information separate from the codebase and protect it from being exposed or compromised in case of a security breach or unauthorized access.
GitHub Repository Secrets are stored securely and can only be accessed by authorized users who have been granted access to the repository. Secrets can be used in workflows, actions, and other scripts associated with the repository. They can be passed as environment variables to the code, so that it can access and use the secrets in a secure, reliable way.
Overall, GitHub Repository Secrets provide a simple and effective way for developers to manage and protect confidential information associated with a repository, helping to ensure the security and integrity of the project and the data it processes.
We now need to integrate this into the project. First, we need to add these two lines to the pom.xml file. Notice that you need to update the organization name to match your own. These should go into the section in the XML:
<sonar.organization>shai-almog</sonar.organization> <sonar.host.url>https://sonarcloud.io</sonar.host.url>
Notice that the JHipster project we created already has SonarQube support which should be removed from the pom file before this code will work.
After this we can replace the “Build with Maven” portion of the maven.yml file with the following version:
 - name: Build with Maven
    env:
       GITHUB_TOKEN: ${{ secrets.GITHUB_TOKEN }}  # Needed to get PR information, if any
       SONAR_TOKEN: ${{ secrets.SONAR_TOKEN }}
    run: mvn -B verify org.sonarsource.scanner.maven:sonar-maven-plugin:sonar -Dsonar.projectKey=shai-almog_HelloJHipster package
Once we do that, SonarCloud will provide reports for every pull request merged into the system as shown here:
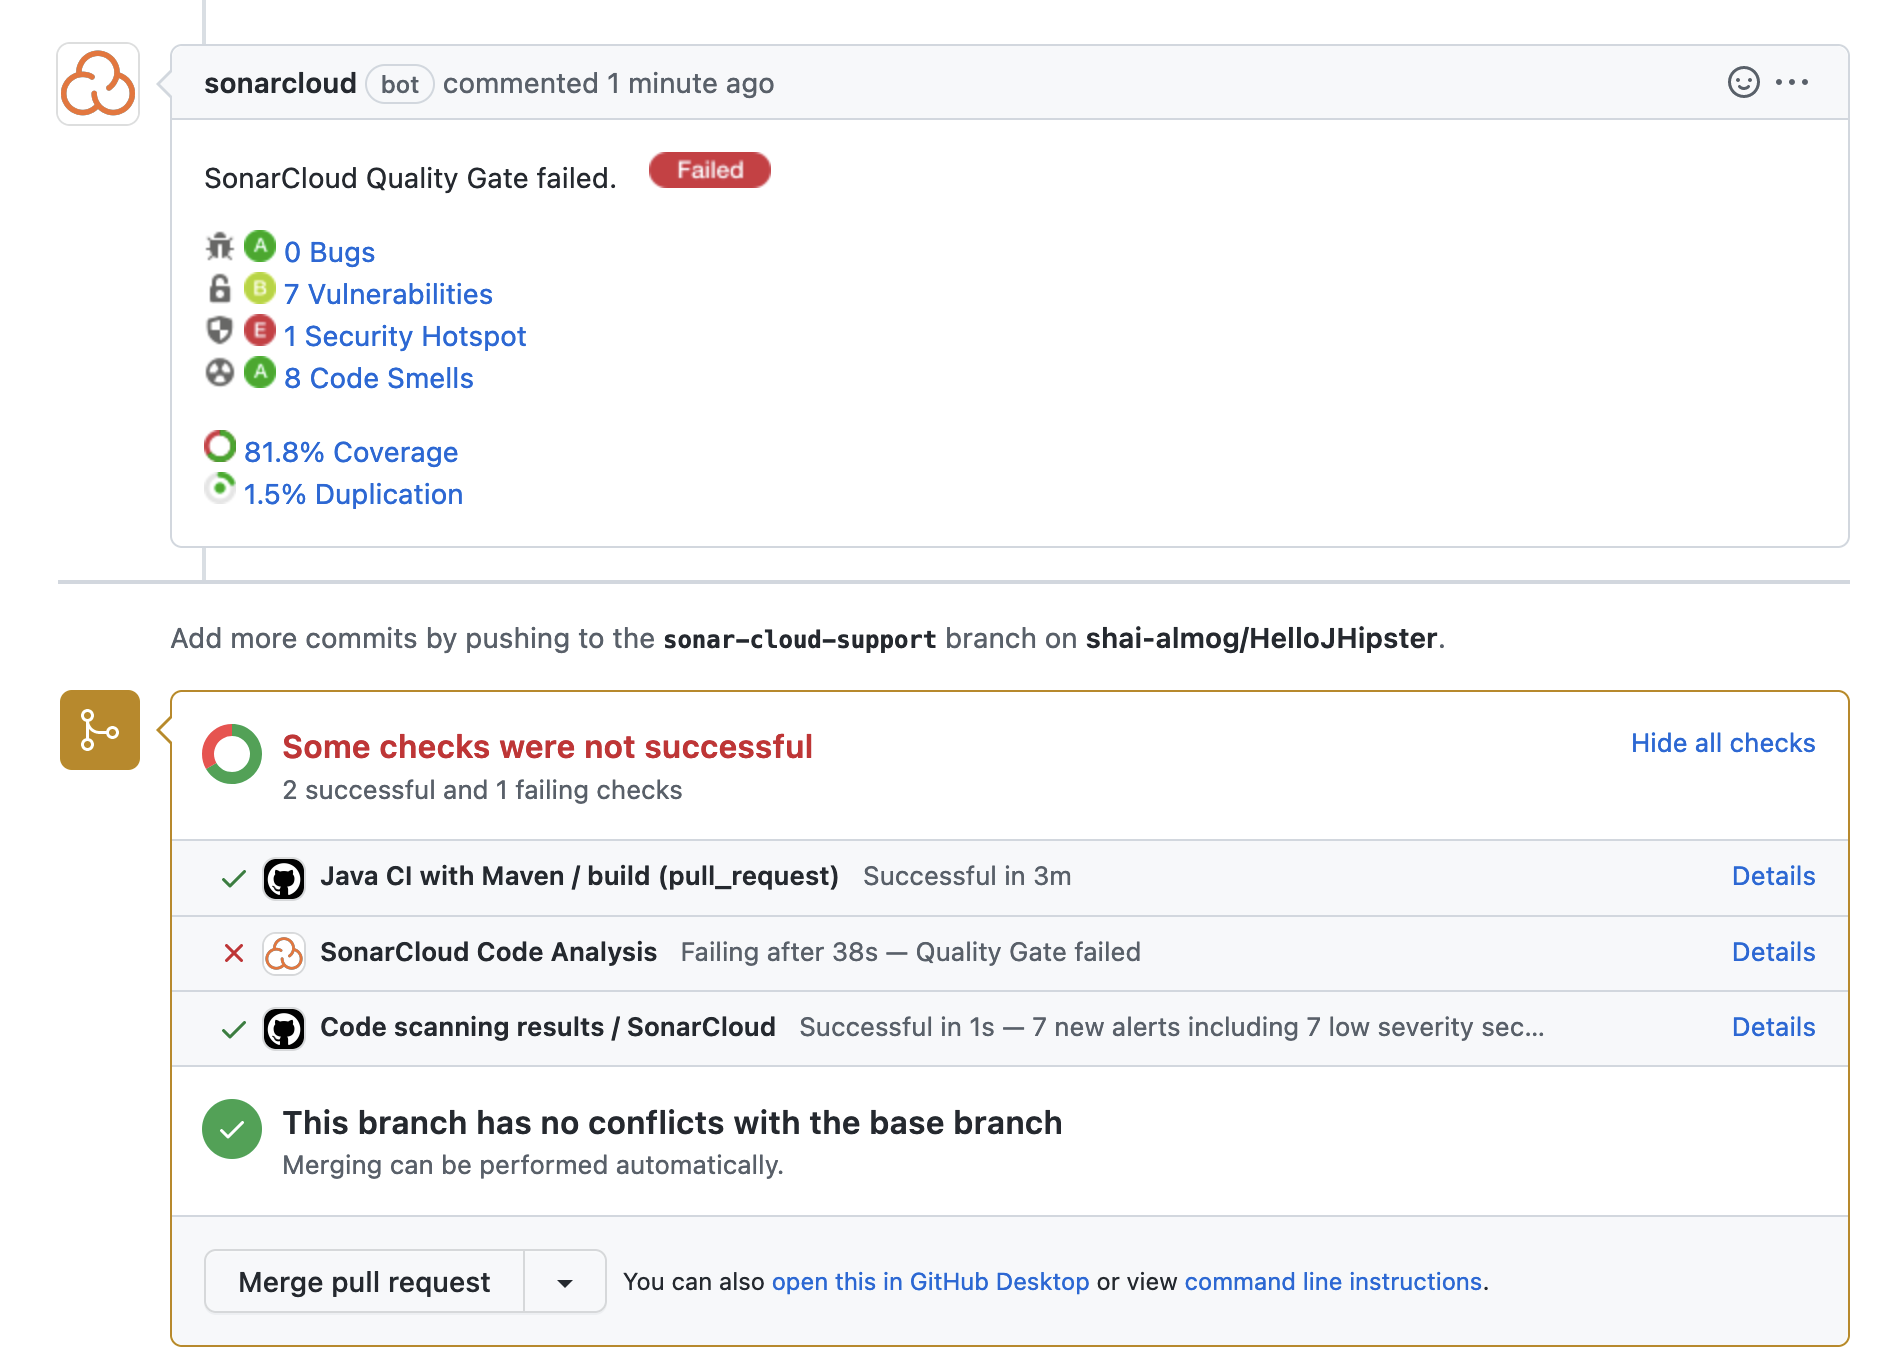
We can see a report that includes the list of bugs, vulnerabilities, smells, and security issues. Clicking every one of those issues leads us to something like this:
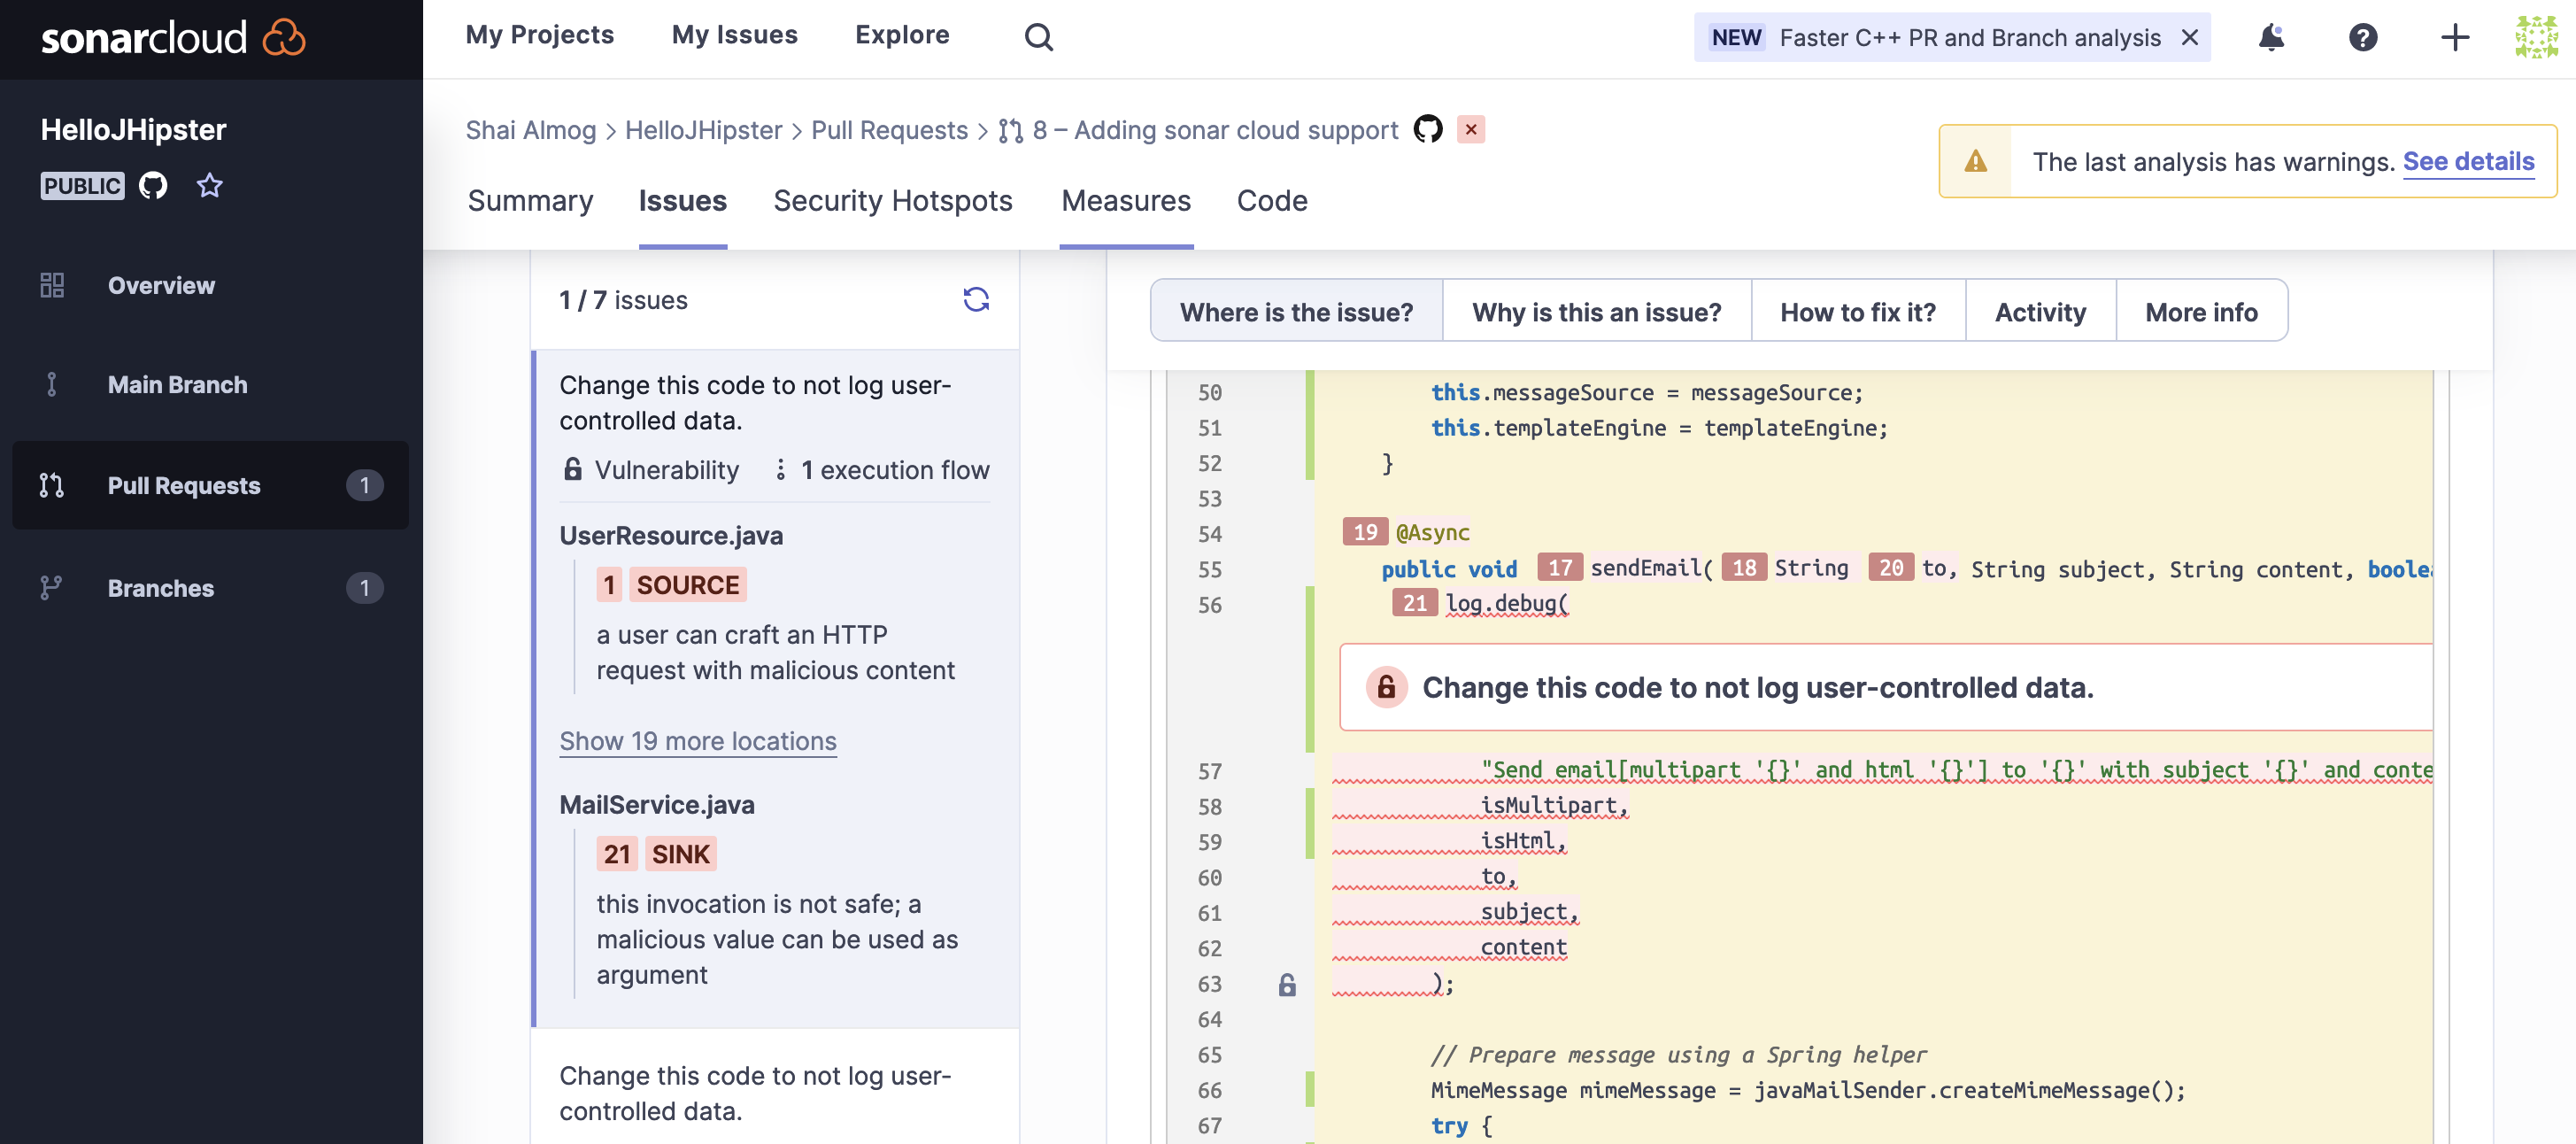
Notice that we have tabs that explain exactly why the issue is a problem, how to fix it and more. This is a remarkably powerful tool that serves as one of the most valuable code reviewers in the team.
Two additional interesting elements we saw before are the coverage and duplication reports. SonarCloud expects that tests will have 80% code coverage (trigger 80% of the code in a pull request), this is high and can be configured in the settings. It also points out duplicate code which might indicate a violation of the Don’t Repeat Yourself (DRY) principle.
Finally
CI is a huge subject with many opportunities to improve the flow of your project. We can automate the detection of bugs. Streamline artifact generation, automated delivery and so much more. But in my humble opinion, the core principle behind CI is developer experience. It’s here to make our lives easier.
When it is done badly, the CI process can turn this amazing tool into a nightmare. Passing the tests becomes an exercise in futility. We retry again and again until we can finally merge. We wait for hours to merge because of slow, crowded queues. This tool that was supposed to help becomes our nemesis. This shouldn’t be the case. CI should make our lives easier, not the other way around.


