Wireshark & tcpdump: A Debugging Power Couple
Explore the power of Wireshark and tcpdump for network analysis in our comprehensive guide, unveiling tips for effective troubleshooting.

Entrepreneur, author, blogger, open source hacker, speaker, Java rockstar, developer advocate and more. ex-Sun/Oracle guy with 30 years of professional development experience. Shai built virtual machines, development tools, mobile phone environments, banking systems, startup/enterprise backends, user interfaces, development frameworks and much more. Shai is an award winning highly rated speaker with a knack for engaging the audience and deep technical chops.
Wireshark, the free open-source packet sniffer and network protocol analyzer, has cemented itself as an indispensable tool in network troubleshooting, analysis, and security (on both sides). This blog post delves into the features, uses, and practical tips for harnessing the full potential of Wireshark, expanding on aspects that may have been glossed over in discussions or demonstrations. Whether you're a developer, security expert, or just curious about network operations, this guide will enhance your understanding of Wireshark and its applications.
As a side note, if you like the content of this and the other posts in this series check out my Debugging book that covers this subject. If you have friends that are learning to code I'd appreciate a reference to my Java Basics book. If you want to get back to Java after a while check out my Java 8 to 21 book.
Introduction to Wireshark
Wireshark was initially developed by Eric Rescorla and Gerald Combs, designed to capture and analyze network packets in real-time. Its capabilities extend across various network interfaces and protocols, making it a versatile tool for anyone involved in networking. Unlike its command-line counterpart, tcpdump, Wireshark's graphical interface simplifies the analysis process, presenting data in a user-friendly "proto view" that organizes packets in a hierarchical structure. This facilitates quick identification of protocols, ports, and data flows.
The key features of Wireshark are:
Graphical User Interface (GUI): Eases the analysis of network packets compared to command-line tools.
Proto View: Displays packet data in a tree structure, simplifying protocol and port identification.
Compatibility: Supports a wide range of network interfaces and protocols.
Browser Network Monitors
FireFox and Chrome contain a far superior network monitor tool built into them. It is superior because it is simpler to use and works with secure websites out of the box. If you can use the browser to debug the network traffic you should do that.
In the cases where your traffic requires low level protocol information or is outside of the browser, Wireshark is the next best thing.
Installation and Getting Started
To begin with Wireshark, visit their official website for the download. The installation process is straightforward, but attention should be paid to the installation of command-line tools, which may require separate steps. Upon launching Wireshark, users are greeted with a selection of network interfaces as seen below. Choosing the correct interface, such as the loopback for local server debugging, is crucial for capturing relevant data.
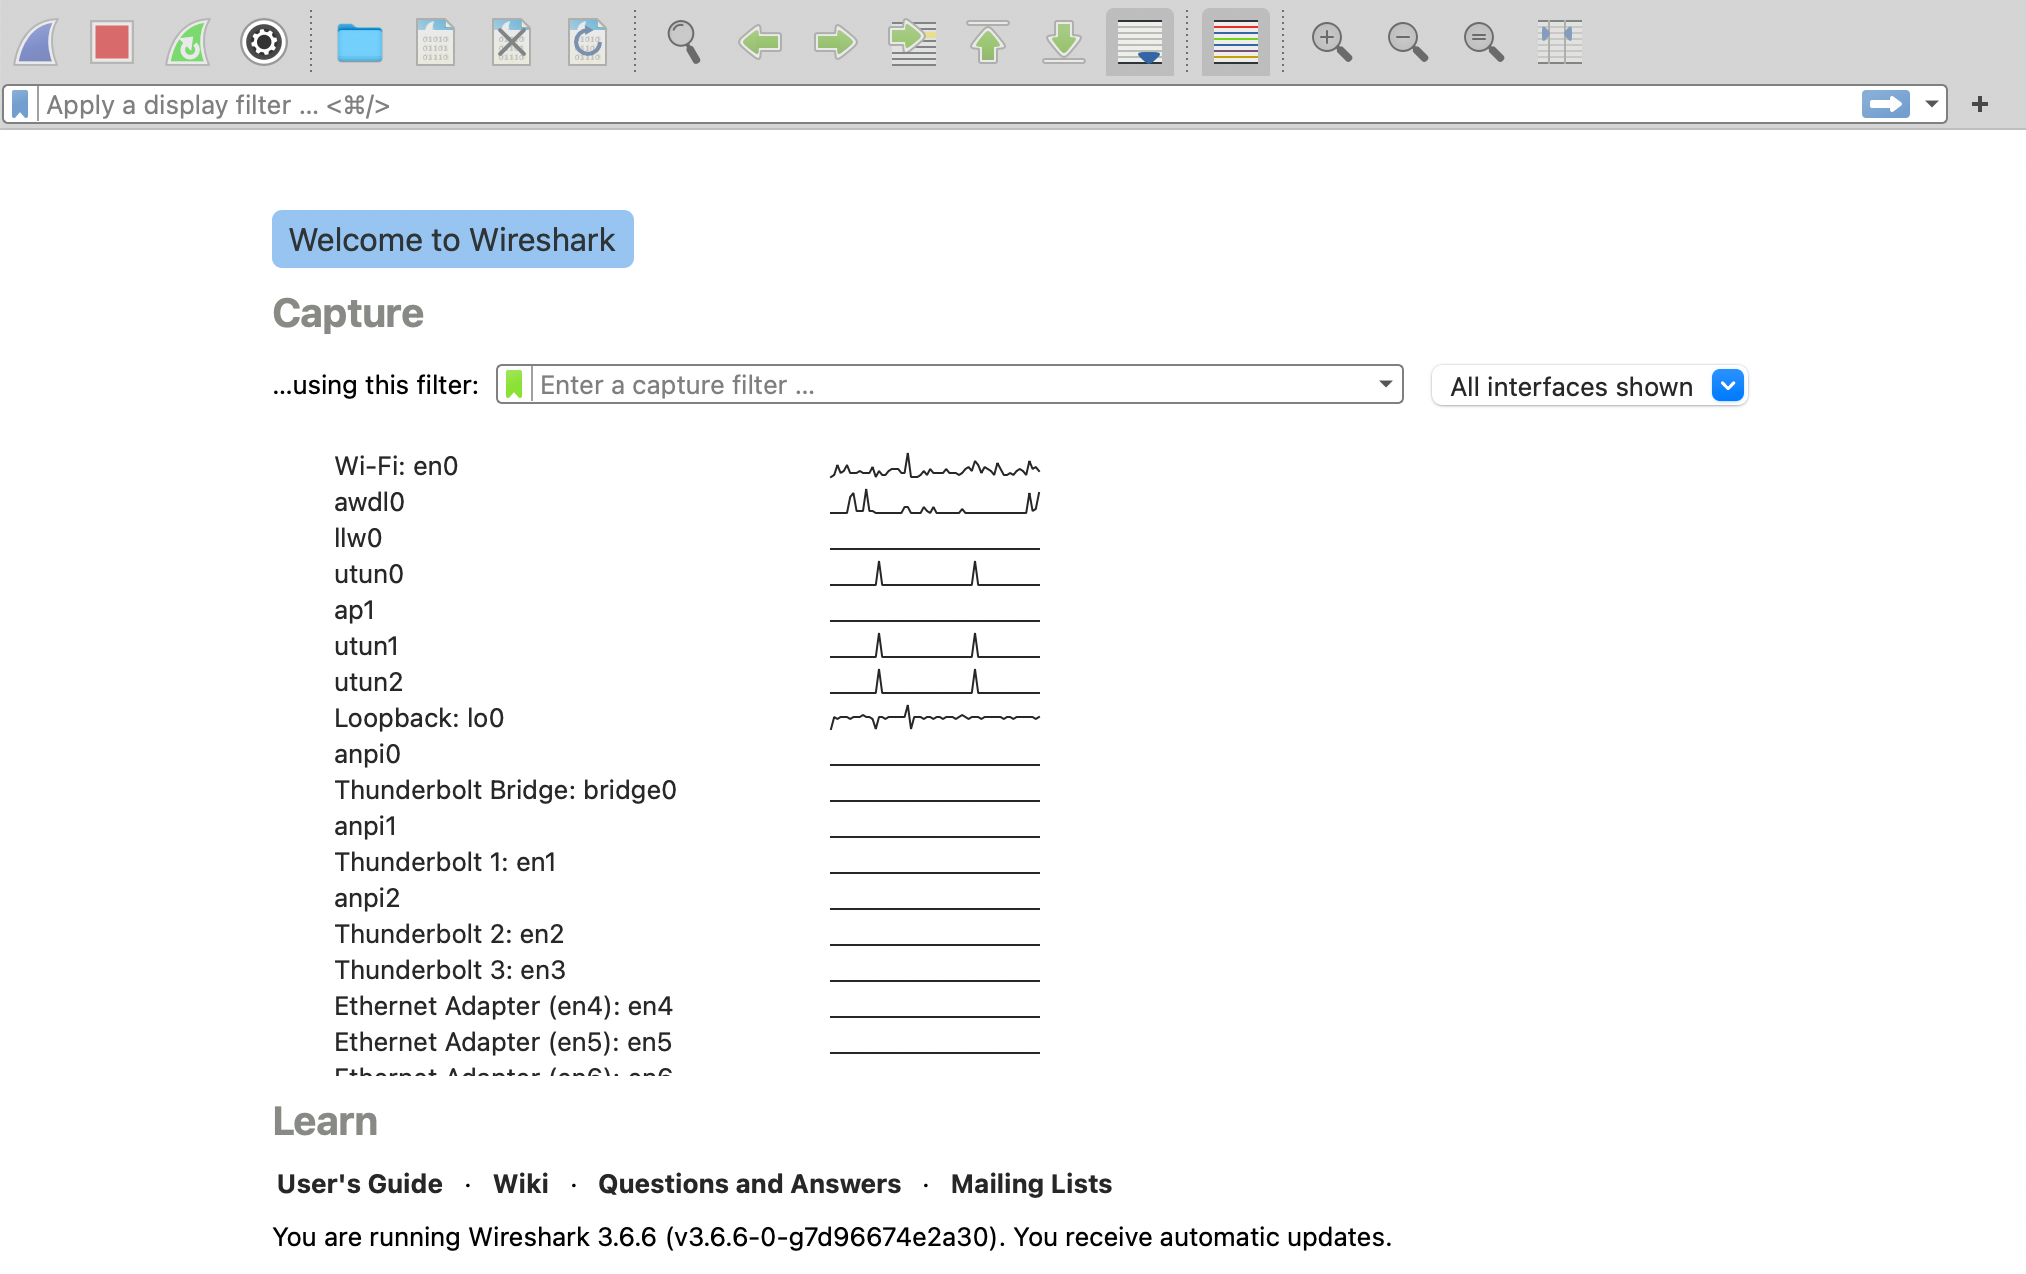
When debugging a Local Server (localhost) use the loopback interface. Remote servers will probably fit with the en0 network adapter. You can use the activity graph next to the network adapter to identify active interfaces for capture.
Navigating Through Noise with Filters
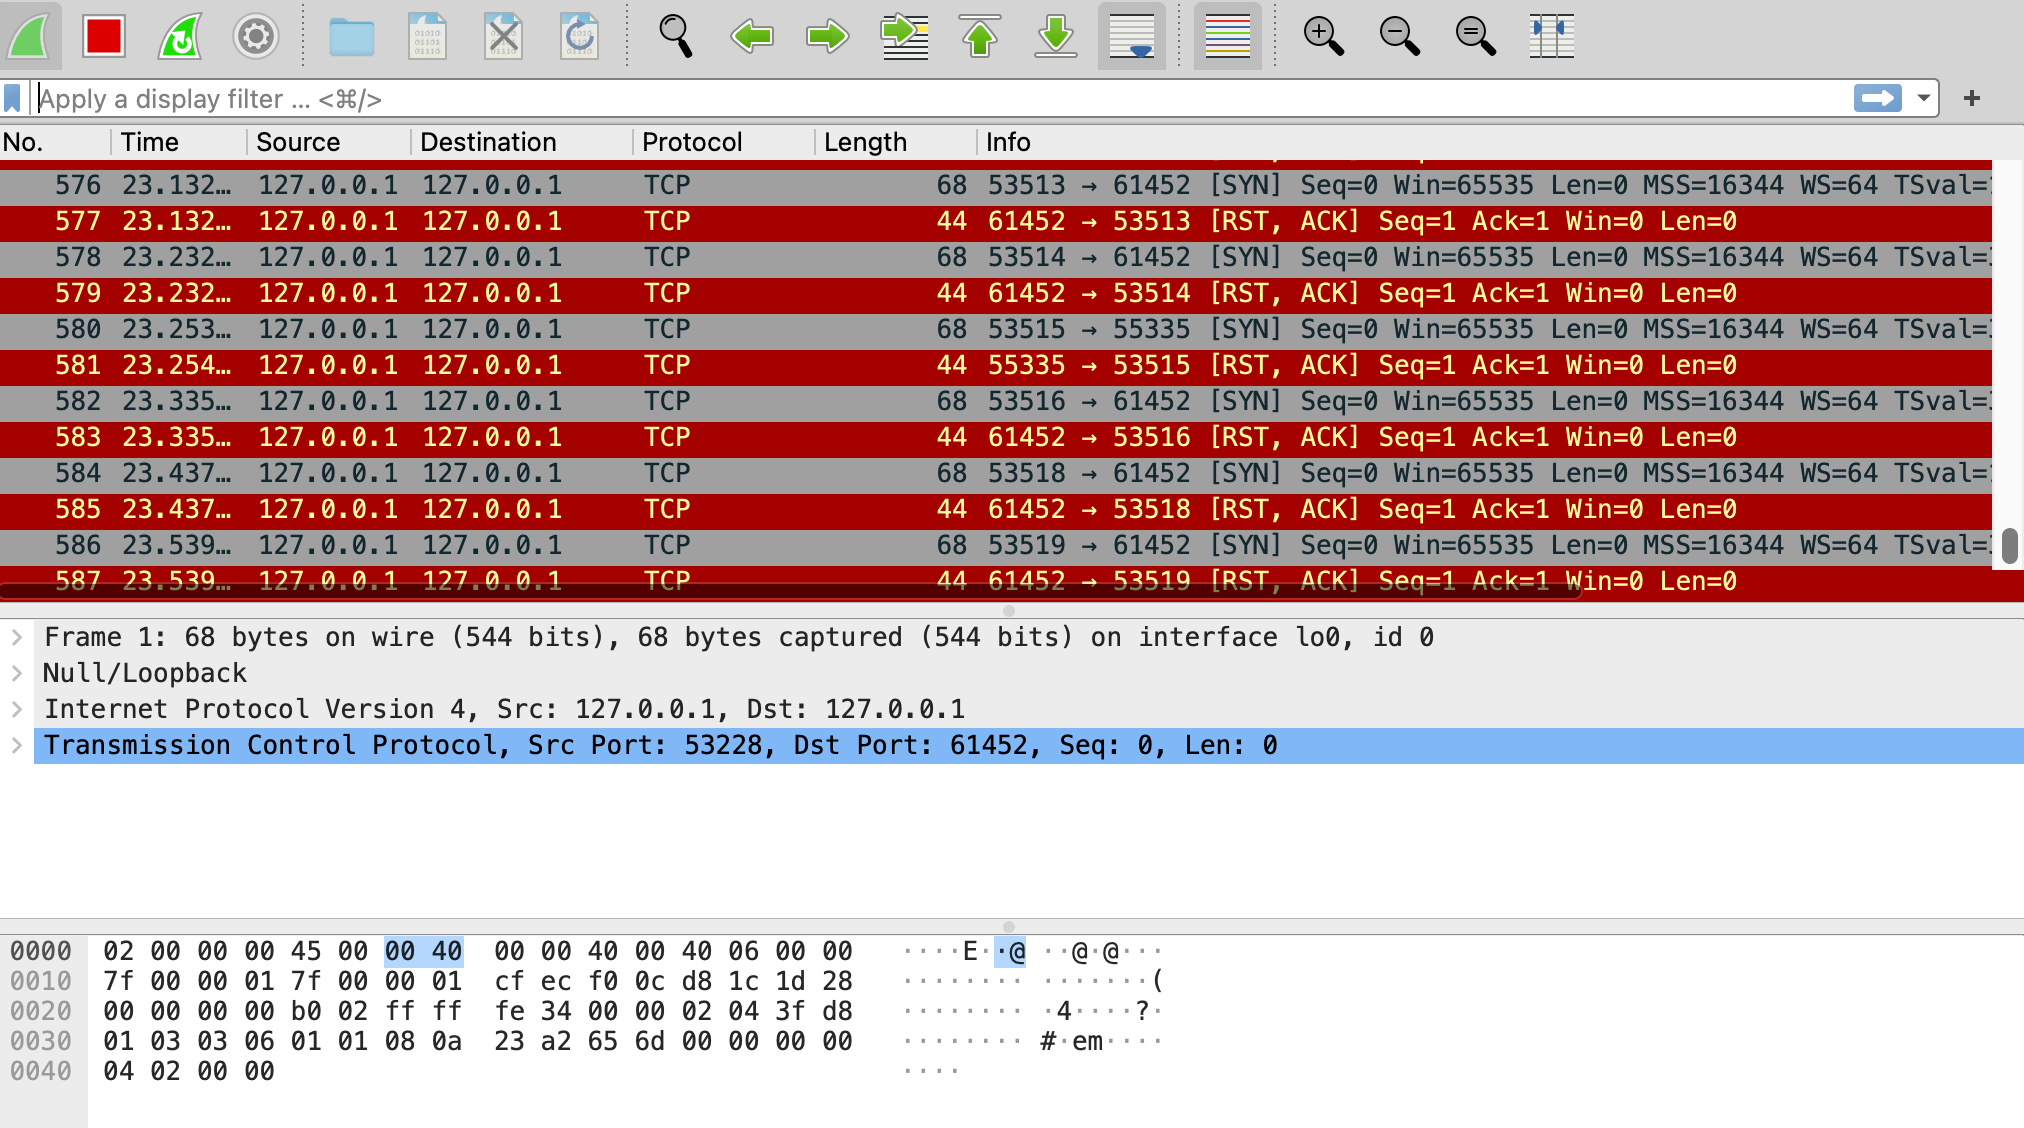
One of the challenges of using Wireshark is the overwhelming amount of data captured, including irrelevant "background noise" as seen in the following image.
Wireshark addresses this with powerful display filters, allowing users to hone in on specific ports, protocols, or data types. For instance, filtering TCP traffic on port 8080 can significantly reduce unrelated data, making it easier to debug specific issues.
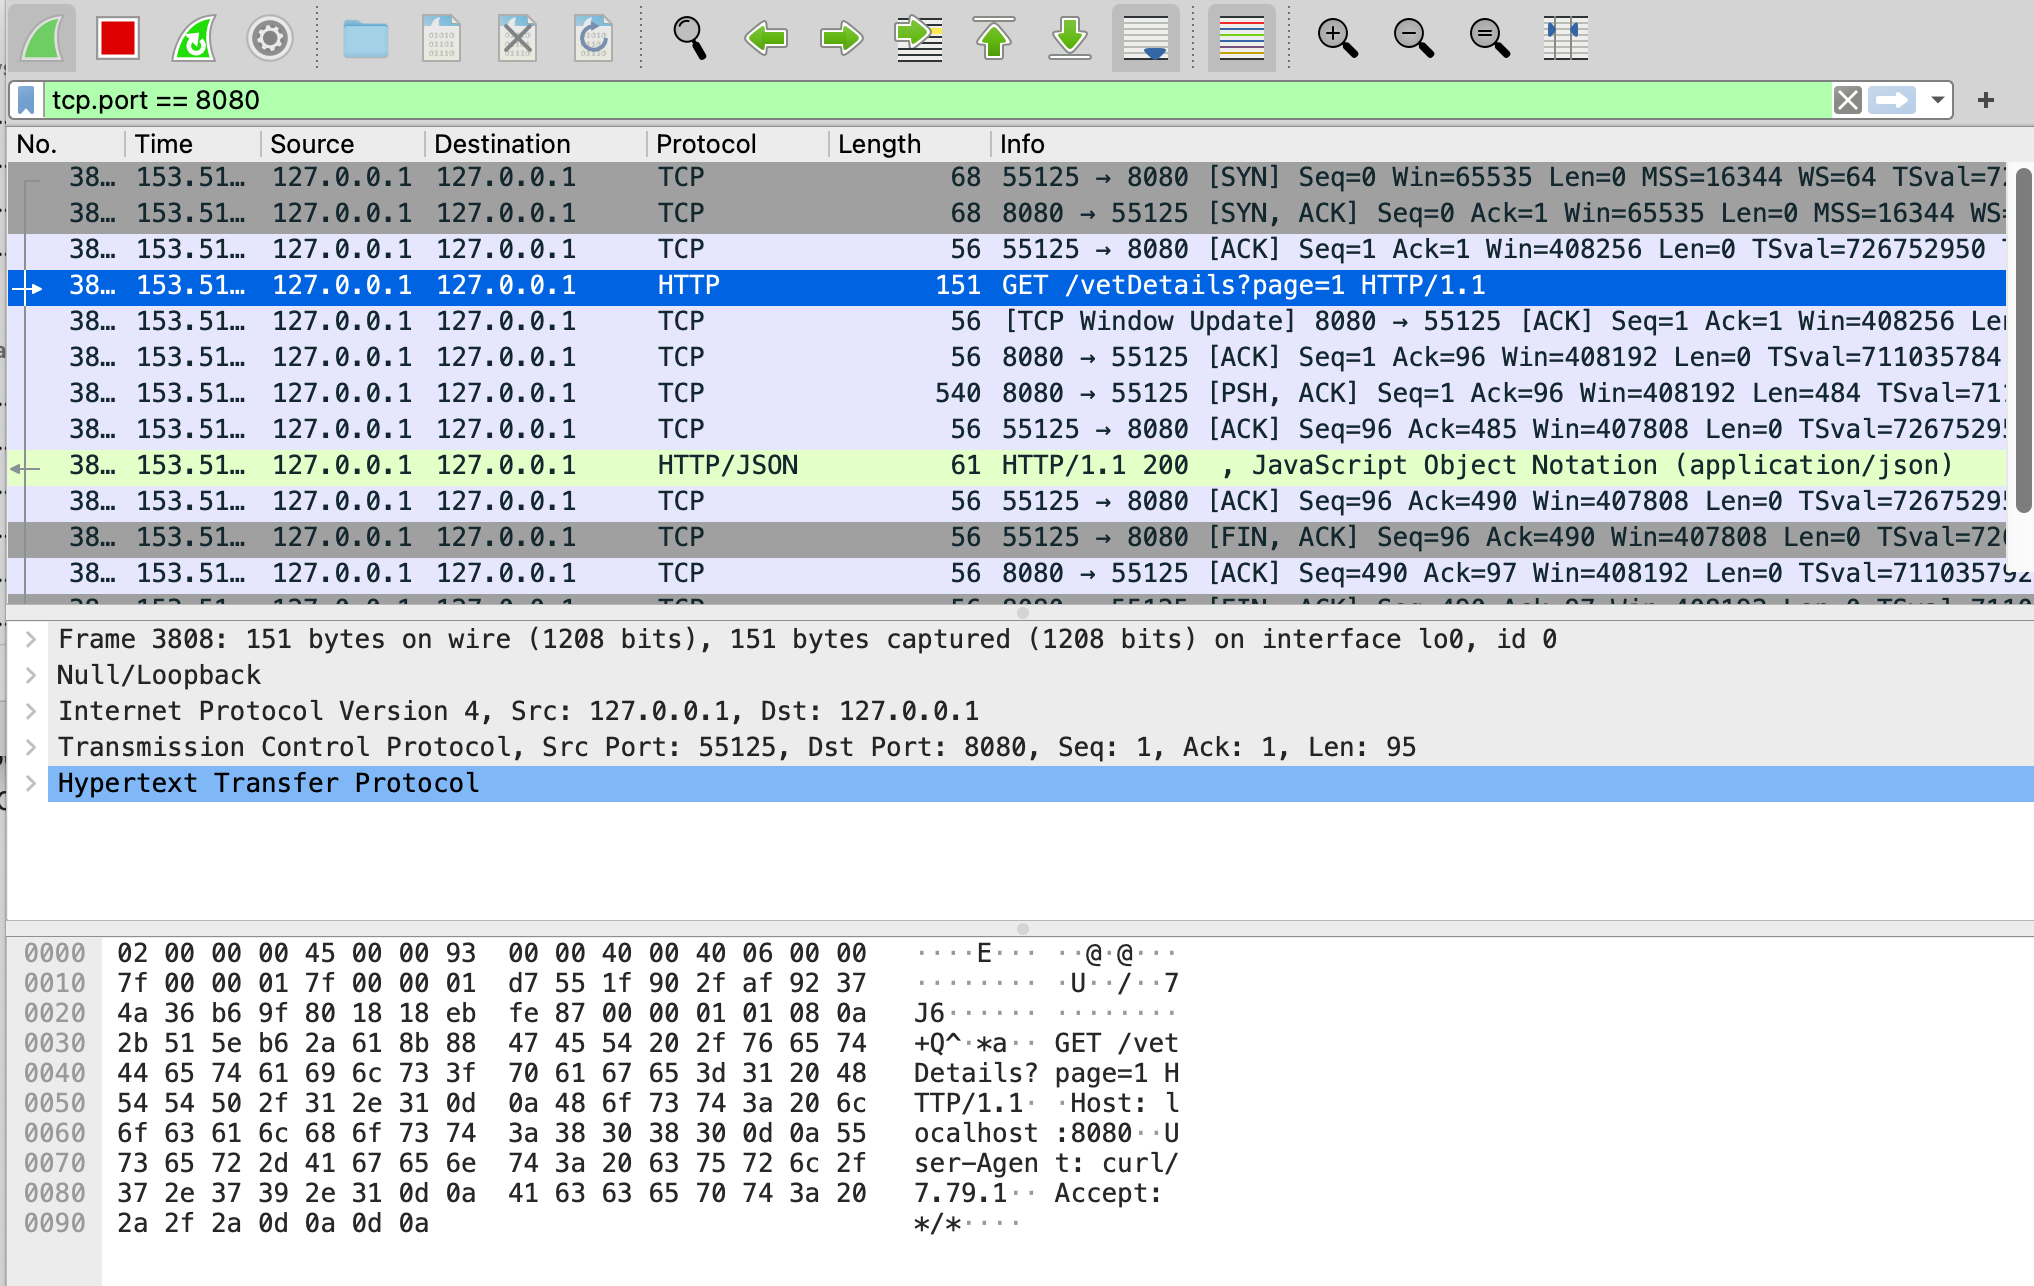
Notice that the there is a completion widget on top of the Wireshark UI that lets you find out the values more easily.
In this case we filter by port tcp.port == 8080 which is the port used typically in Java servers (e.g. Spring Boot/tomcat).
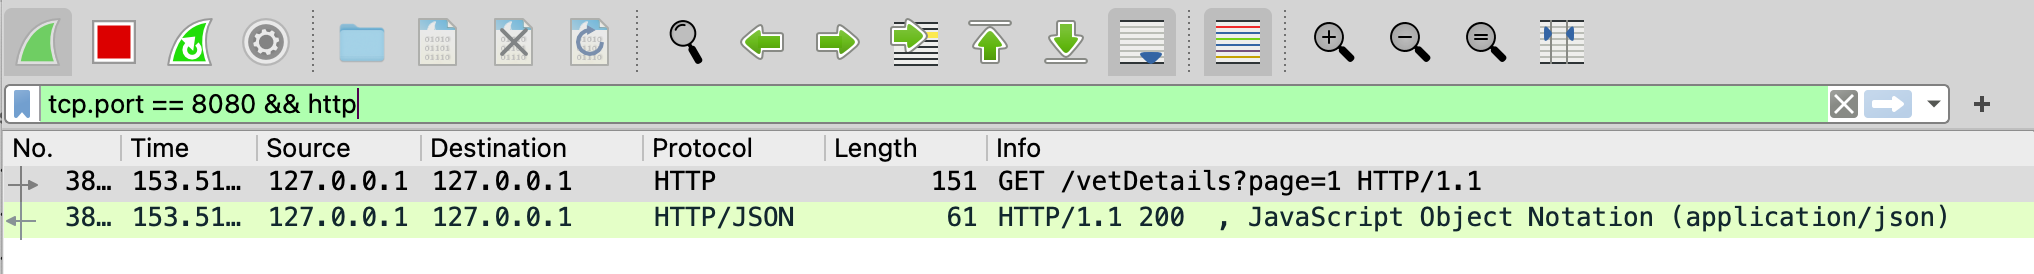
But this isn't enough as HTTP is more concise. We can filter by protocol by adding http to the filter which narrows the view to HTTP requests and responses as shown in the following image.
Deep Dive into Data Analysis
Wireshark excels in its ability to dissect and present network data in an accessible manner. For example, HTTP responses carrying JSON data are automatically parsed and displayed in a readable tree structure as seen below. This feature is invaluable for developers and analysts, providing insights into the data exchanged between clients and servers without manual decoding.
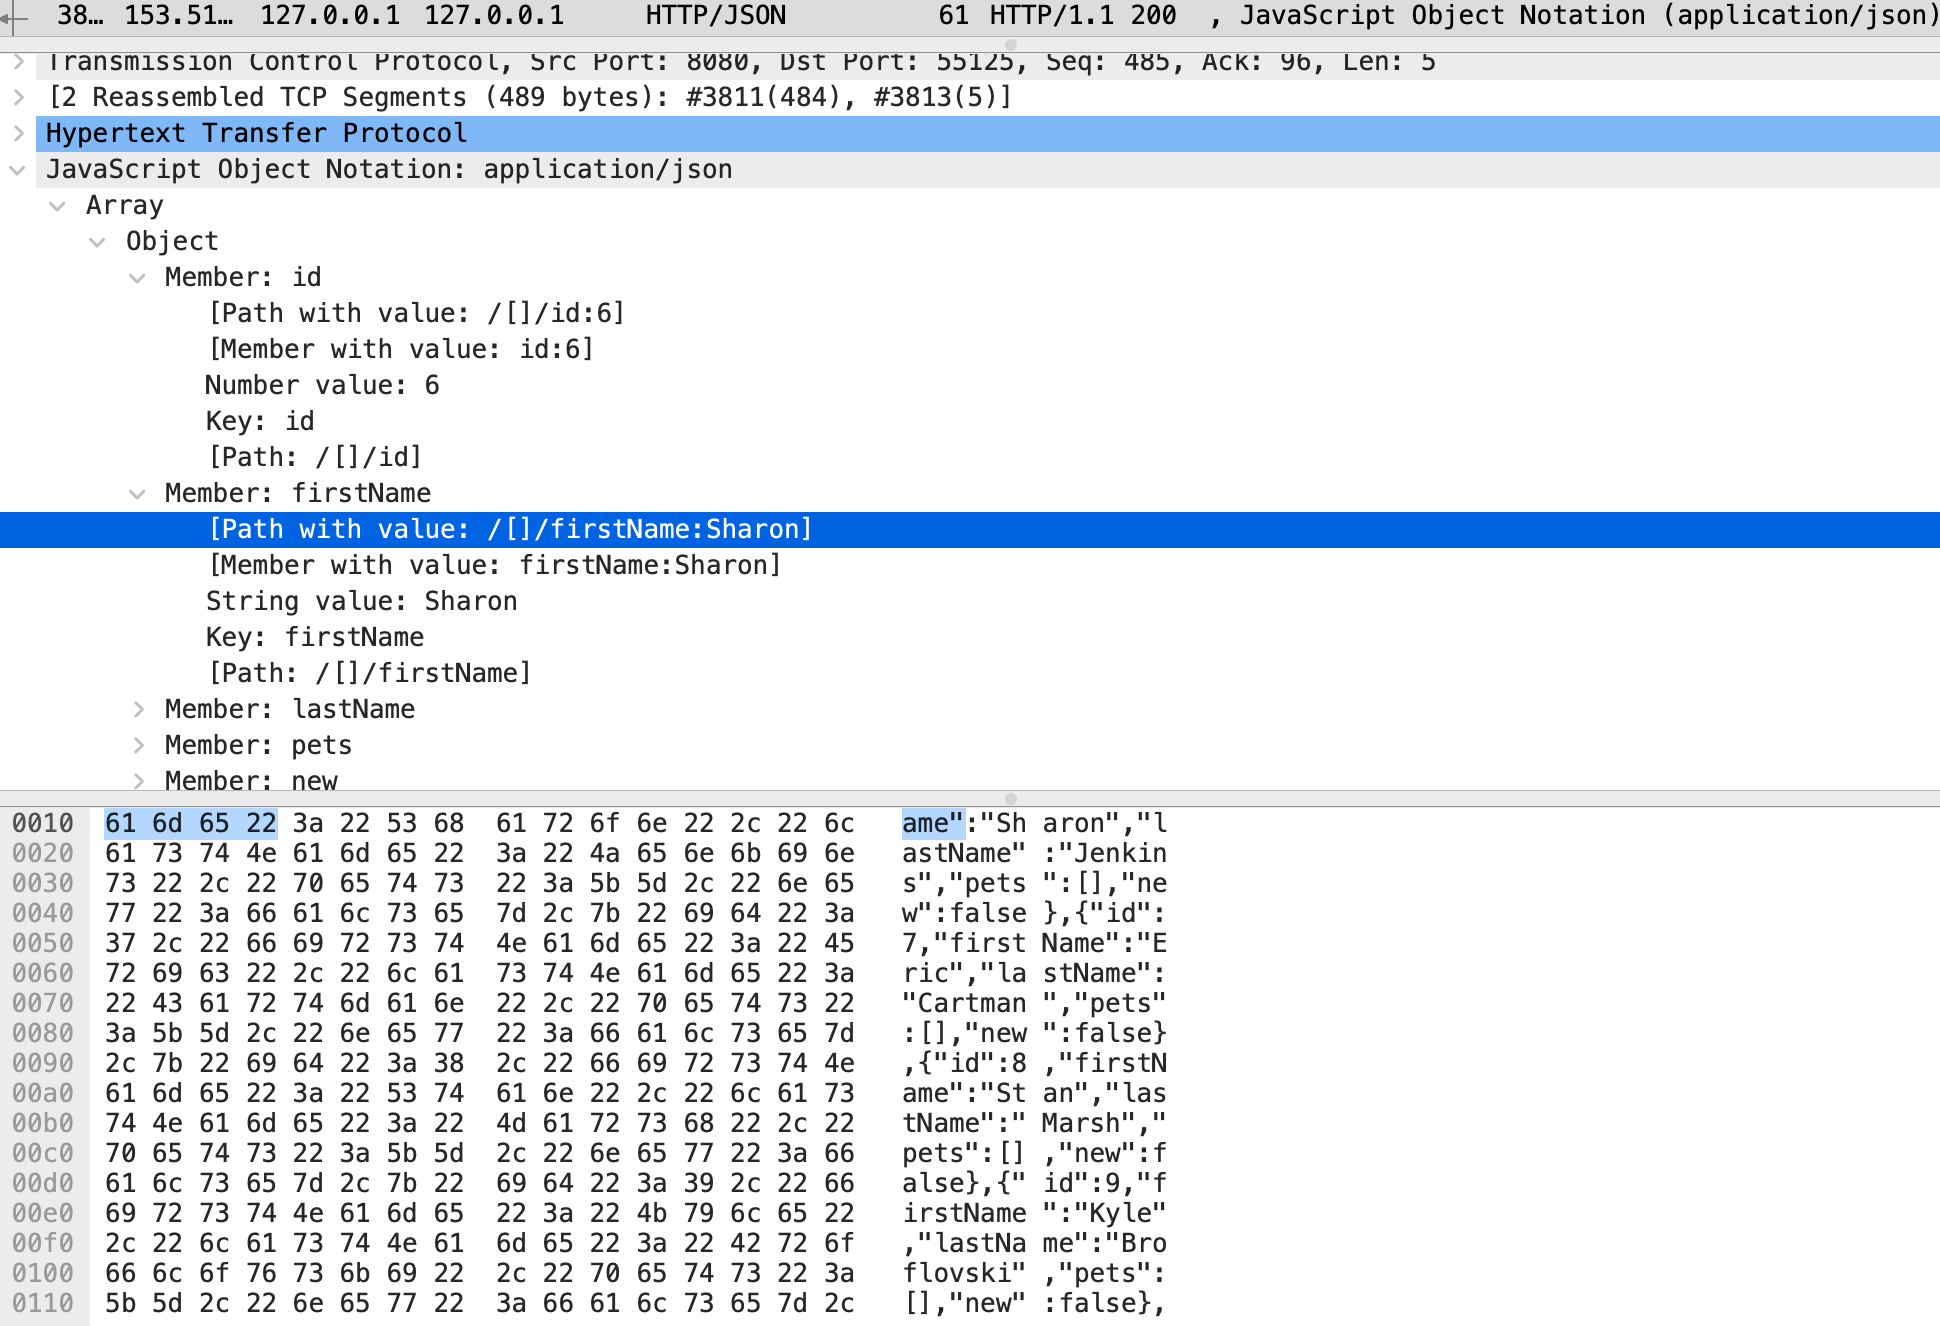
Wireshark parses and displays JSON data within the packet analysis pane. It offers both hexadecimal and ASCII views for raw packet data.
Beyond Basic Usage
While Wireshark's basic functionalities cater to a wide range of networking tasks, its true strength lies in advanced features such as ethernet network analysis, HTTPS decryption, and debugging across devices. These tasks, however, may involve complex configuration steps and a deeper understanding of network protocols and security measures.
There are two big challenges when working with Wireshark:
HTTPS Decryption: Decrypting HTTPS traffic requires additional configuration but offers visibility into secure communications.
Device Debugging: Wireshark can be used to troubleshoot network issues on various devices, requiring specific knowledge of network configurations.
The Basics of HTTPS Encryption
HTTPS uses the Transport Layer Security (TLS) or its predecessor, Secure Sockets Layer (SSL), to encrypt data. This encryption mechanism ensures that any data transferred between the web server and the browser remains confidential and untouched. The process involves a series of steps including handshake, data encryption, and data integrity checks.
Decrypting HTTPS traffic is often necessary for developers and network administrators to troubleshoot communication errors, analyze application performance, or ensure that sensitive data is correctly encrypted before transmission. It's a powerful capability in diagnosing complex issues that cannot be resolved by simply inspecting unencrypted traffic or server logs.
Methods for Decrypting HTTPS in Wireshark
Important: Decrypting HTTPS traffic should only be done on networks and systems you own or have explicit permission to analyze. Unauthorized decryption of network traffic can violate privacy laws and ethical standards.
Pre-Master Secret Key Logging
One common method involves using the pre-master secret key to decrypt HTTPS traffic. Browsers like Firefox and Chrome can log the pre-master secret keys to a file when configured to do so. Wireshark can then use this file to decrypt the traffic:
Configure the Browser: Set an environment variable (
SSLKEYLOGFILE) to specify a file where the browser will save the encryption keys.Capture Traffic: Use Wireshark to capture the traffic as usual.
Decrypt the Traffic: Point Wireshark to the file with the pre-master secret keys (through Wireshark's preferences) to decrypt the captured HTTPS traffic.
Using a Proxy
Another approach involves routing traffic through a proxy server that decrypts HTTPS traffic and then re-encrypts it before sending it to the destination. This method might require setting up a dedicated decryption proxy that can handle the TLS encryption/decryption:
Set Up a Decryption Proxy: Tools like Mitmproxy or Burp Suite can act as an intermediary that decrypts and logs HTTPS traffic.
Configure Network to Route Through Proxy: Ensure the client's network settings route traffic through the proxy.
Inspect Traffic: Use the proxy's tools to inspect the decrypted traffic directly.
Integrating tcpdump with Wireshark for Enhanced Network Analysis
While Wireshark offers a graphical interface for analyzing network packets, there are scenarios where using it directly may not be feasible due to security policies or operational constraints. tcpdump, a powerful command-line packet analyzer, becomes invaluable in these situations, providing a flexible and less intrusive means of capturing network traffic.
The Role of tcpdump in Network Troubleshooting
tcpdump allows for the capture of network packets without a graphical user interface, making it ideal for use in environments with strict security requirements or limited resources. It operates under the principle of capturing network traffic to a file, which can then be analyzed at a later time or on a different machine using Wireshark.
Key Scenarios for tcpdump Usage:
High-security Environments: In places like banks or government institutions where running network sniffers might pose a security risk, tcpdump offers a less intrusive alternative.
Remote Servers: Debugging issues on a cloud server can be challenging with Wireshark due to the graphical interface; tcpdump captures can be transferred and analyzed locally.
Security-conscious Customers: Customers may be hesitant to allow third-party tools to run on their systems; tcpdump's command-line operation is often more palatable.
Using tcpdump Effectively
Capturing traffic with tcpdump involves specifying the network interface and an output file for the capture. This process is straightforward but powerful, allowing for detailed analysis of network interactions:
Command Syntax: The basic command structure for initiating a capture involves specifying the network interface (e.g.,
en0for wireless connections) and the output file name.Execution: Once the command is run, tcpdump silently captures network packets. The capture continues until it's manually stopped, at which point the captured data can be saved to the specified file.
Opening Captures in Wireshark: The file generated by tcpdump can be opened in Wireshark for detailed analysis, utilizing Wireshark's advanced features for dissecting and understanding network traffic.
The following shows the tcpdump command and its output:
$ sudo tcpdump -i en0 -w output
Password:
tcpdump: listening on en, link-type EN10MB (Ethernet), capture size 262144 bytes
^C3845 packets captured
4189 packets received by filter
0 packets dropped by kernel
Challenges and Considerations
Identifying the correct network interface for capture on remote systems might require additional steps, such as using the ifconfig command to list available interfaces. This step is crucial for ensuring that relevant traffic is captured for analysis.
Final Word
Wireshark stands out as a powerful tool for network analysis, offering deep insights into network traffic and protocols. Whether it's for low-level networking work, security analysis, or application development, Wireshark's features and capabilities make it an essential tool in the tech arsenal. With practice and exploration, users can leverage Wireshark to uncover detailed information about their networks, troubleshoot complex issues, and secure their environments more effectively.
Wireshark's blend of ease of use with profound analytical depth ensures it remains a go-to solution for networking professionals across the spectrum. Its continuous development and wide-ranging applicability underscore its position as a cornerstone in the field of network analysis.
Combining tcpdump's capabilities for capturing network traffic with Wireshark's analytical prowess offers a comprehensive solution for network troubleshooting and analysis. This combination is particularly useful in environments where direct use of Wireshark is not possible or ideal. While both tools possess a steep learning curve due to their powerful and complex features, they collectively form an indispensable toolkit for network administrators, security professionals, and developers alike.
This integrated approach not only addresses the challenges of capturing and analyzing network traffic in various operational contexts but also highlights the versatility and depth of tools available for understanding and securing modern networks.